Tracking property market performance since Covid-19 - how bad is it really?
Samantha is a Sydney-based real estate and home improvement writer. She is currently Head of Marketing at OpenAgent.
Learn more about our editorial guidelines.
It’s now been over a month since the Covid-19 pandemic unleashed havoc on the Australian real estate market, with agents, buyers and sellers alike bracing for transactions to fall off a cliff.
In mid-March, economists had gloomy predictions about property prices and soaring unemployment rates, Westpac’s Chief Economist Bill Evans stated that unemployment could reach 11.1% by June, and AMP’s Shane Oliver estimated that prices could fall as much as 20% if the recession lasts more than six months.
There is a reason why employment rates matter for the property market and that’s because property is a consumption good. The primary factors that affect property values are employment opportunity and income growth. When more and more Australians lose their jobs and income, this puts downward pressure on consumer confidence.
It’s part of the reason why the Australian government has put so many fiscal measures in place to keep businesses running, and in turn ensure that as many Australians as possible keep their jobs.
While the last reported national unemployment rate from the ABS was 5.2% for March, this only took into account the first two weeks of the month, meaning that the full impact of Coronavirus is yet to show.
April figures are expected to rise sharply, with Federal Treasurer Josh Frydenberg quoting an unemployment rate of around 10% by the end of June. Without the $130 billion JobKeeper stimulus, Treasury estimates that the unemployment rate would’ve peaked at around 15%.
So unemployment is rising, but what’s happening to real estate transactions, time taken to sell and housing values? Let’s explore that more deeply.
Transactions are slowing as a result of Covid-19
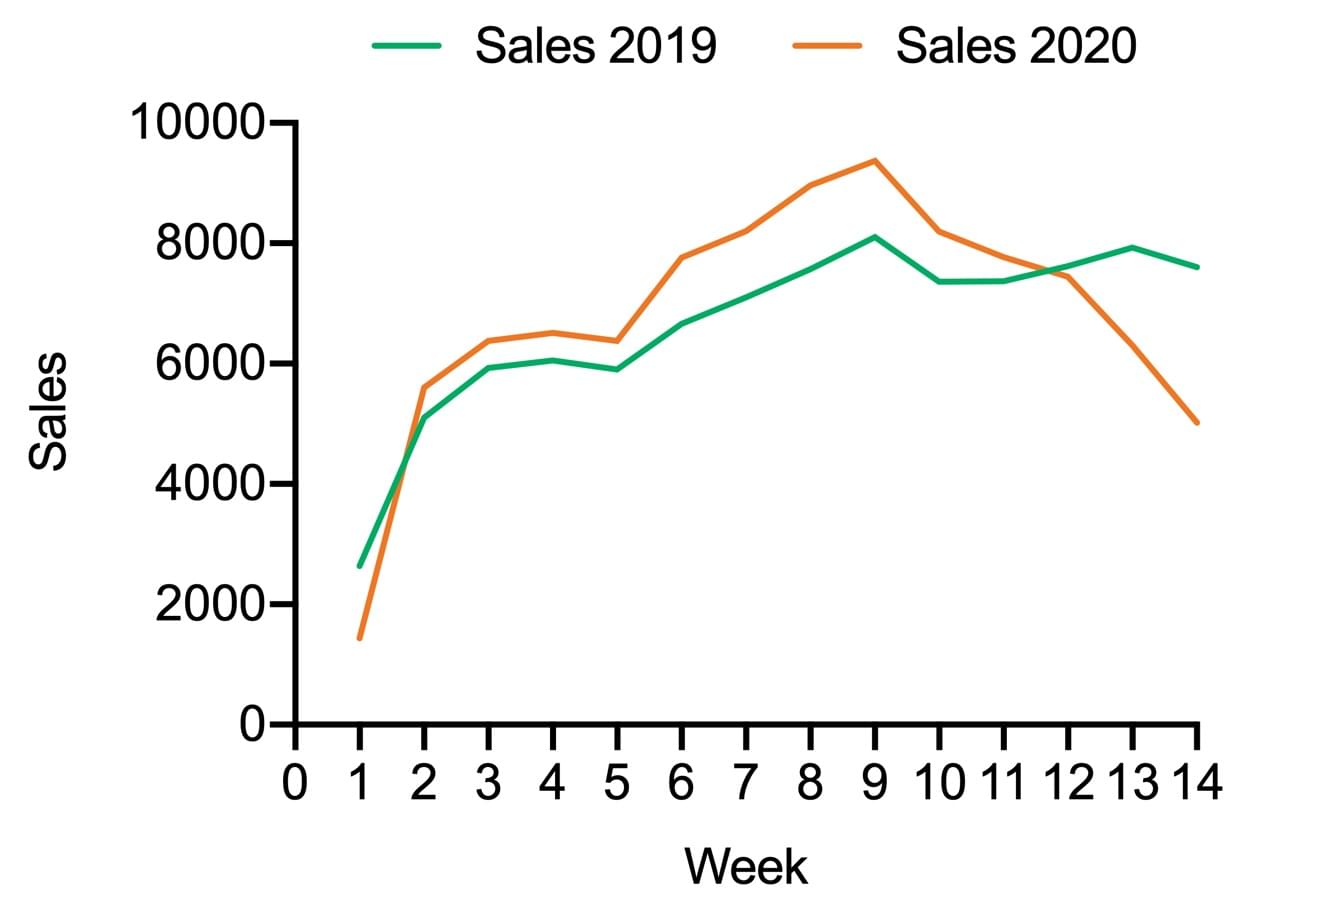
At a national level, when comparing sales data between 2020 and the same time last year, there are two immediate things that stand out. By week 9 of 2020, we can see that sales peaked, followed by a small decrease in week 10. Week 10 was the beginning of March, around the same time that Coronavirus started to hit our radar.
In contrast, in 2019 we can see that from week 10 until Easter there was an upward trend in sales. In 2020, however, sales continued to trend down as a result of the tightening of social distancing measures, and by week 12, the weekly number of sales fell below 2019 levels, when the property market was near the bottom of a downturn.
When we look at sales week-on-week, from week 13 we start to see an accelerated decrease in sales, moving from a ~4% decrease in week 12 to ~15% by week 13. This large drop corresponds to the announcement of the ban on auctions and open-for-inspections, which has had the biggest impact on how the real estate market operates.
Overall, year on year, we’re currently seeing about a 34% drop in sales volumes.
Are states all behaving the same?
When we isolate year-on-year sales data at a state level, we can see that each state is more or less following the same pattern throughout 2020.
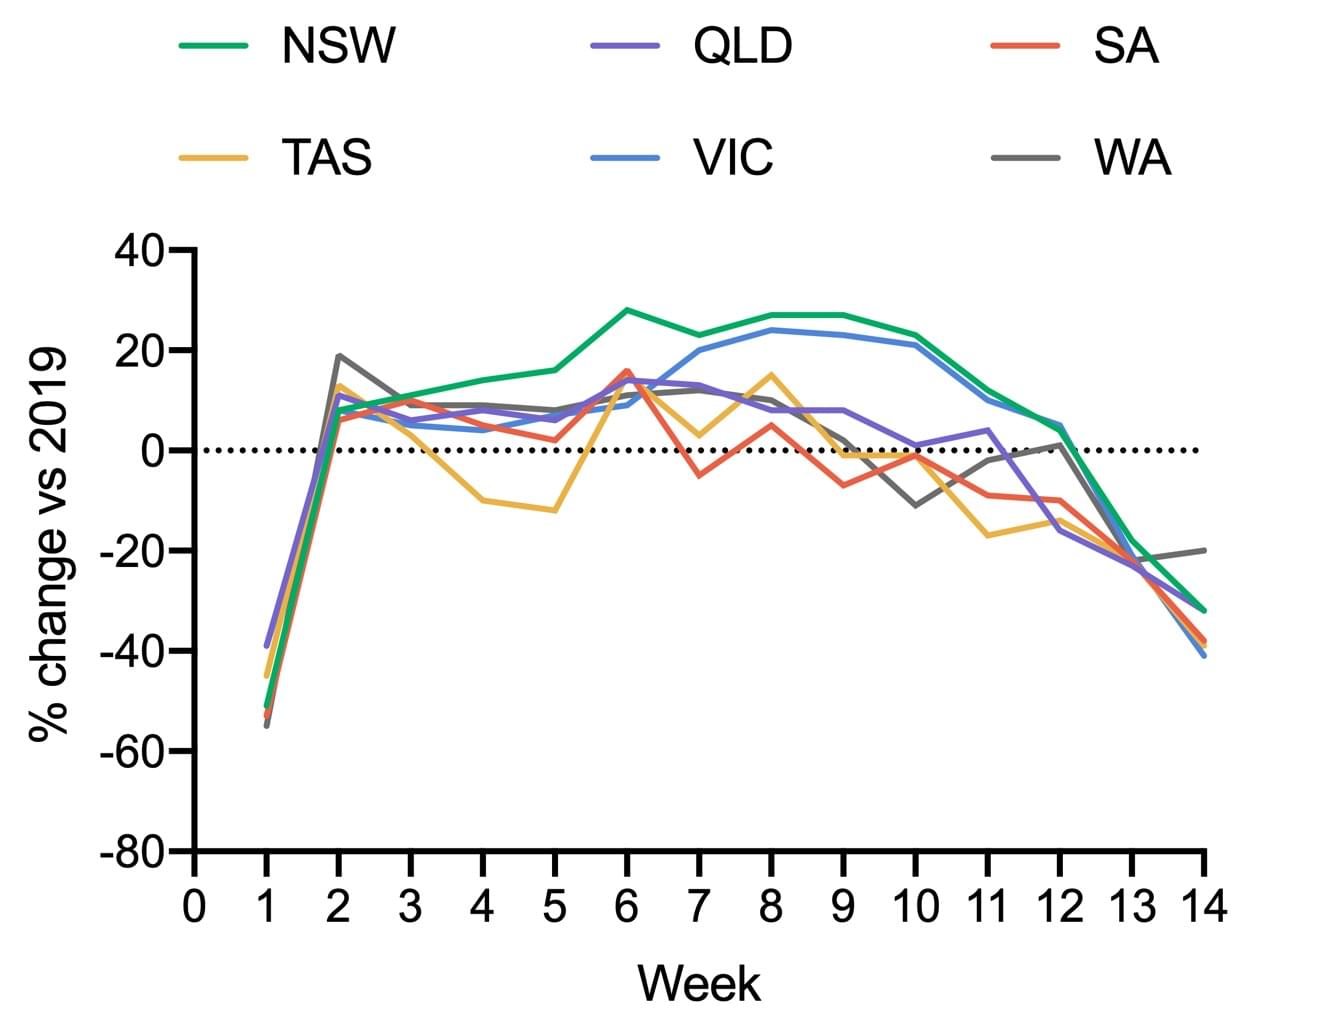
In week 8 (the second last week in February), most states were on a good trajectory, and had actually grown in sales volume compared to the same time in 2019. At this time, the property market was in a really strong place; auction clearance rates were high, and in some states, dwelling values were even at their peak.
Unfortunately, in just five weeks, the situation has changed rapidly. From week 13 onwards, all states are recording less transactions than they did in the same period in 2019.
All states have around a 30% decrease in sales compared to last year, with the exception of Western Australia, a state where the property market has not been as strong since the end of the mining boom.
If we isolate 2020 performance alone, all states have shown at least a 30% decrease in sale numbers since their peak level this year, and the number of transactions have been decreasing for three consecutive weeks. NSW and Queensland sales numbers have been falling consecutively for around six weeks.
Regional Australia versus metropolitan Australia
We always tend to hear that regional and metropolitan property markets operate quite differently, but how true has this been in light of Covid-19, a pandemic that affects us all nationally? We looked at the number of sales per week so far in 2020, and compared volume to what we saw at the same time during 2019.
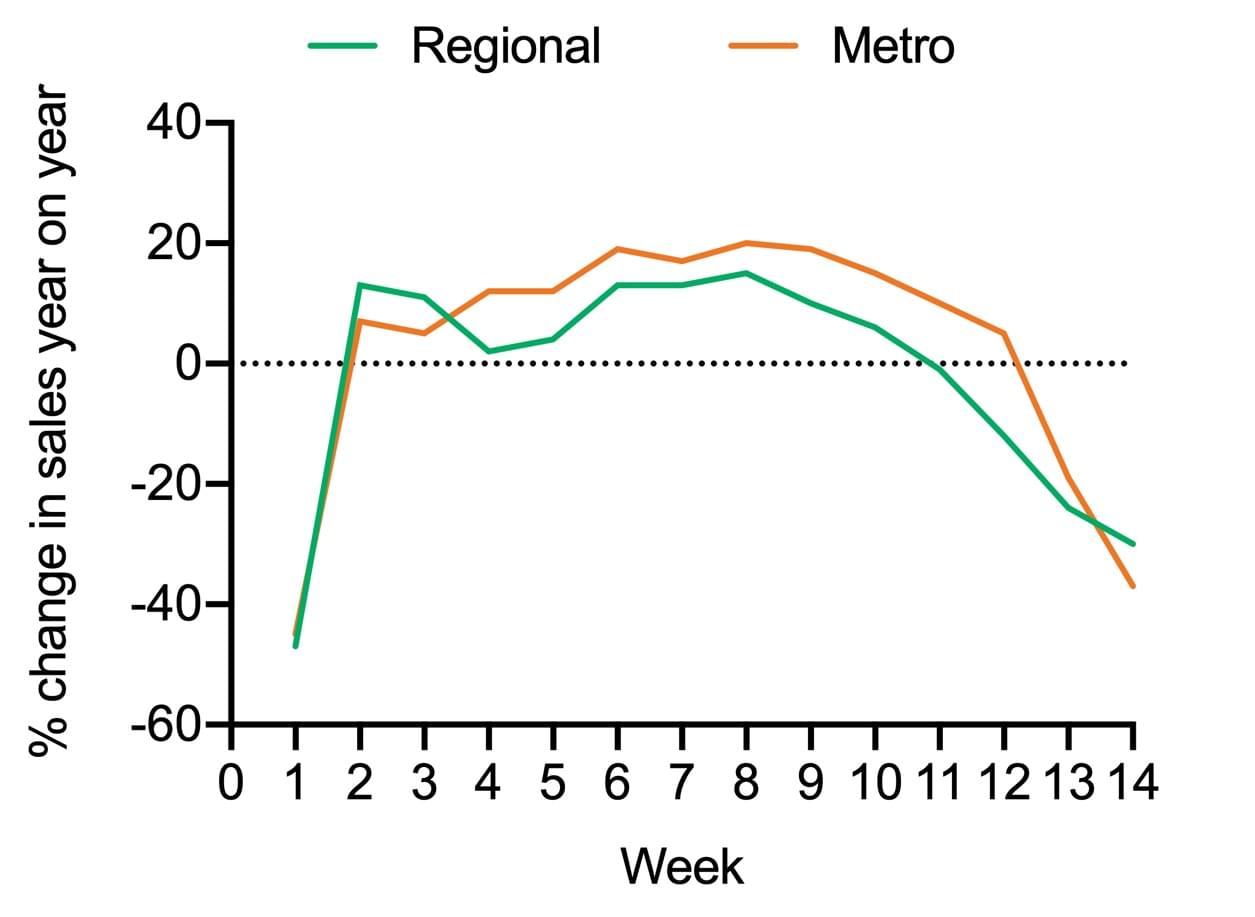
From week 11 (the second week of March), regional sales volume started trending lower than last year. Metro areas took a little longer to dip, and it wasn’t until week 13 that sales started to go below what we saw this time in 2019. Week 13 was the week that auctions and open inspections were banned, which is why we start to see an acceleration of downward growth.
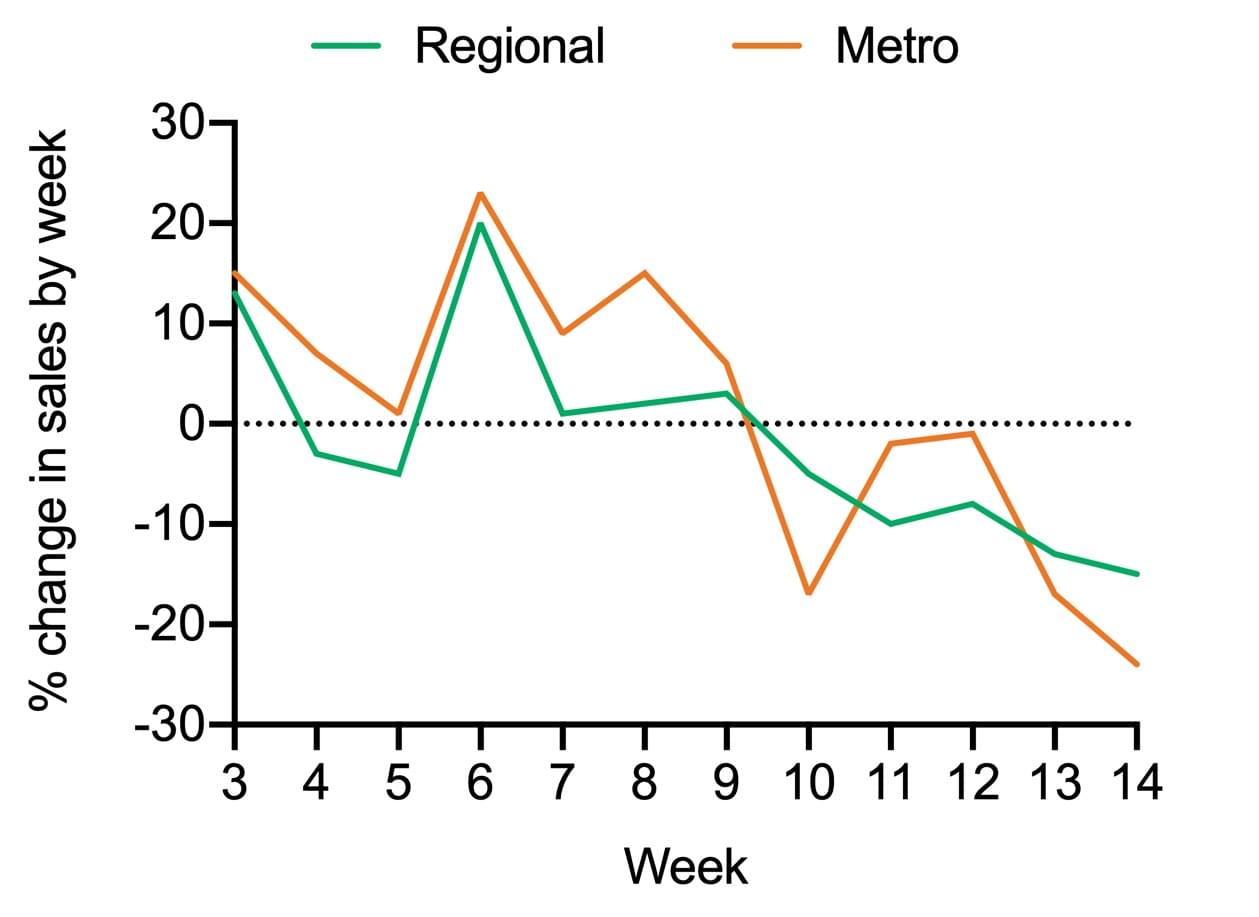
When we look at 2020 on their own, interestingly both metro and regional areas go into negative sales growth at the same time in week 10. At this time, there’s a larger decrease in sales in metro areas, this is likely due to metro property markets being more sensitive to exogenous shocks.
Are properties taking longer to sell?
Let’s dive into data around days on market, or, how long it’s taking for properties to sell at a national level.
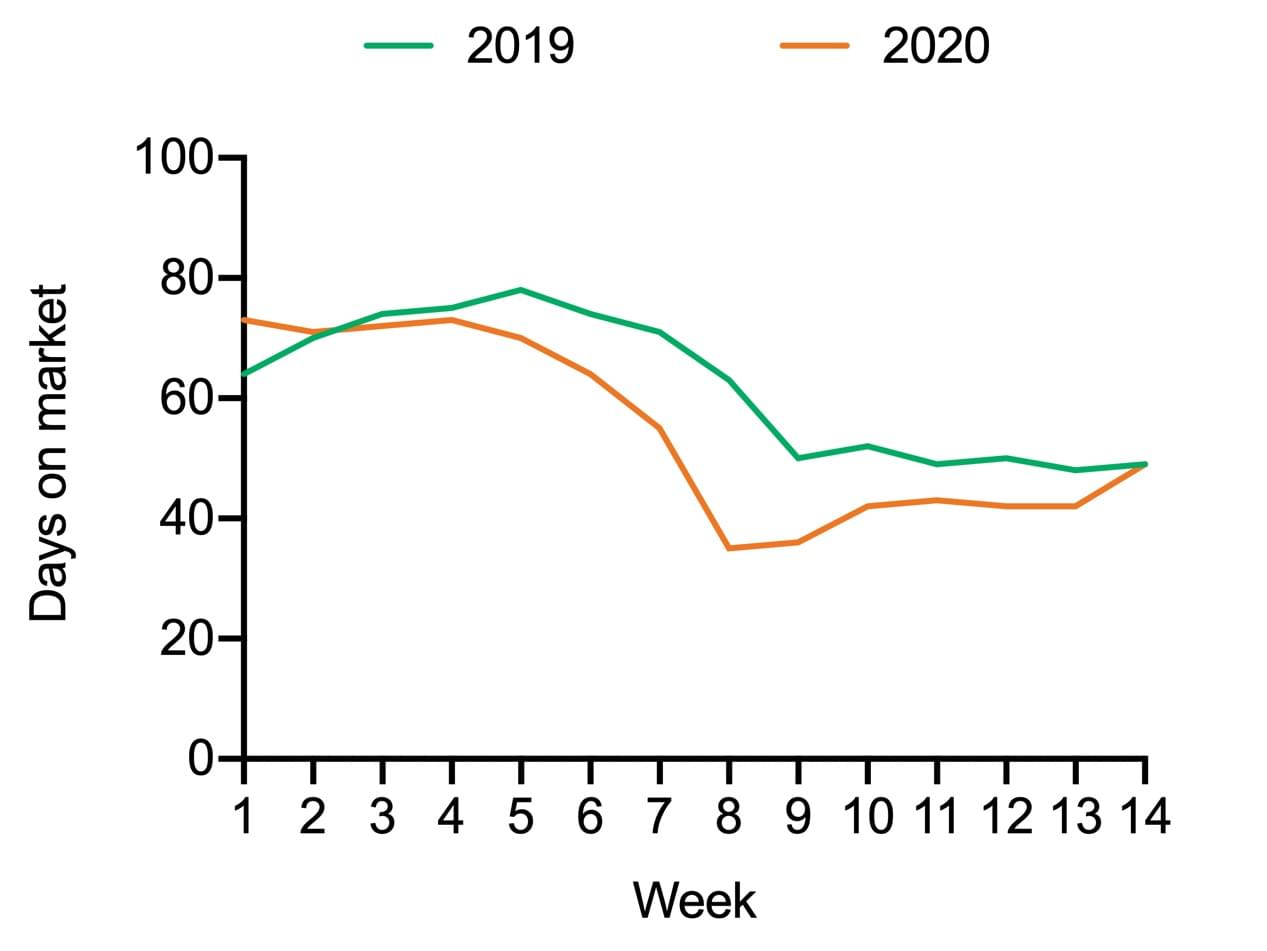
In comparison to this time in 2019, 2020 had started off quite well. At the start of 2019, we were in a downturn, and in 2020, we can see that days on market (DoM) improved from week 3 up until week 14.
In week 8 alone, the number of days it took to sell was 35 days, compared to 63 days in 2019. At that time, selling a property was nearly one month faster than the same time in 2019. After social distancing took effect, the property market lost its momentum, and by week 14, DoM moved back to 2019 levels.
Data from the latest week shows us that the national median days for a listing to clear is currently 54 days, and that increase has been quite modest. However, we expect this number to climb, given that market activity activity has slowed, and there are properties that are still sitting on the market that have not been sold, and therefore not accounted for in this data.
It’s also important to note that while this is the national trend, specific areas and suburbs may behave differently. We always recommend that you do your research. It is helpful to speak to a local agent about how the market is performing in your area before making a decision.
Are properties selling faster in metro or regional areas?
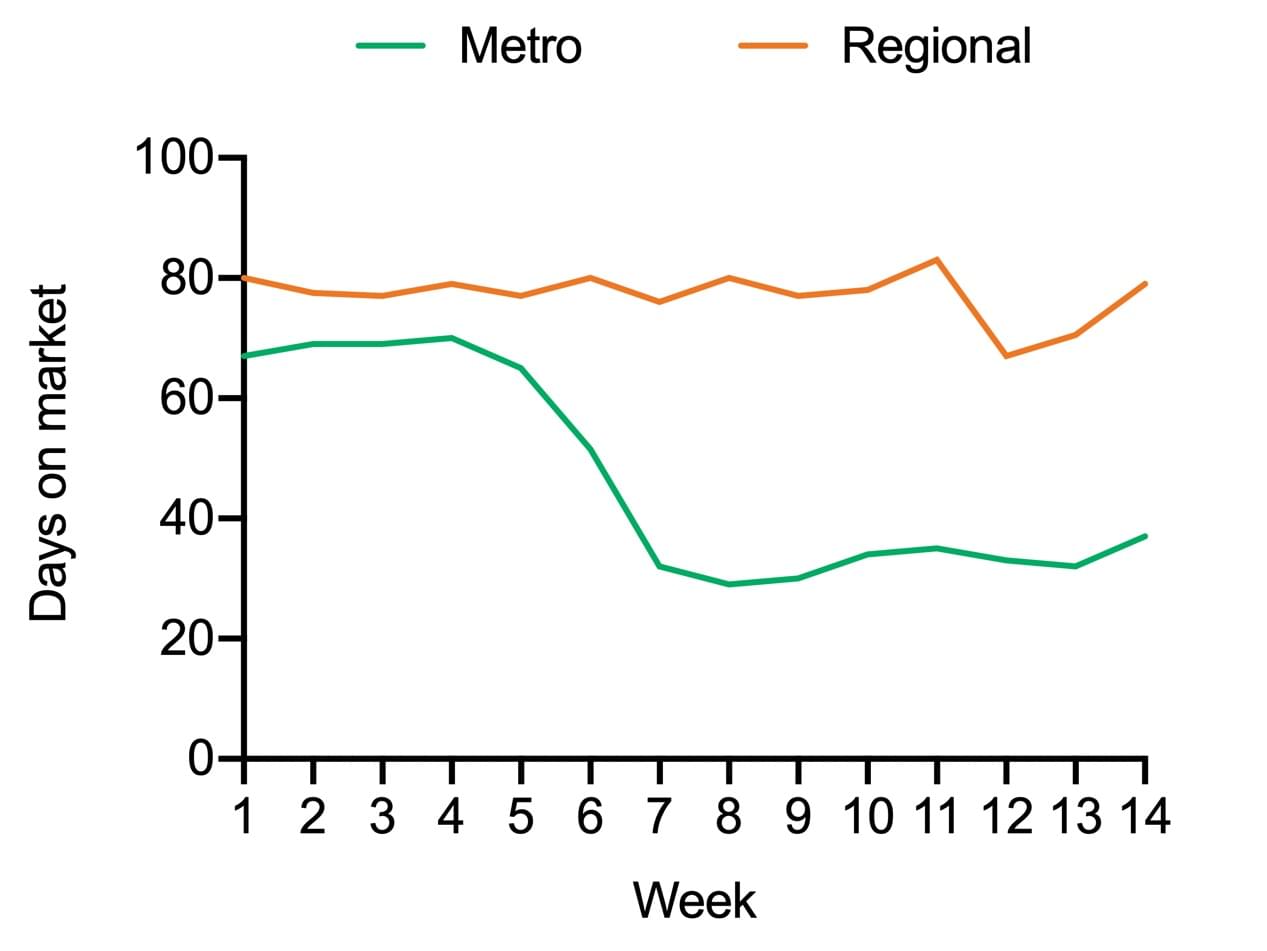
Interestingly, the data shows us that regional days on market had been increasing steadily throughout the year, and before Covid-19. On the other hand, time to sell in metro areas has mostly been decreasing since the start of January, it’s only now in April that we’re starting to see signs over the last four weeks that days on market are increasing closer to the level they were at this time last year.
Are housing prices holding steady?
From a values standpoint, the latest CoreLogic Daily Home Value Index data shows that housing value growth started to slow in mid-March, and data throughout mid-April saw this trend continue.
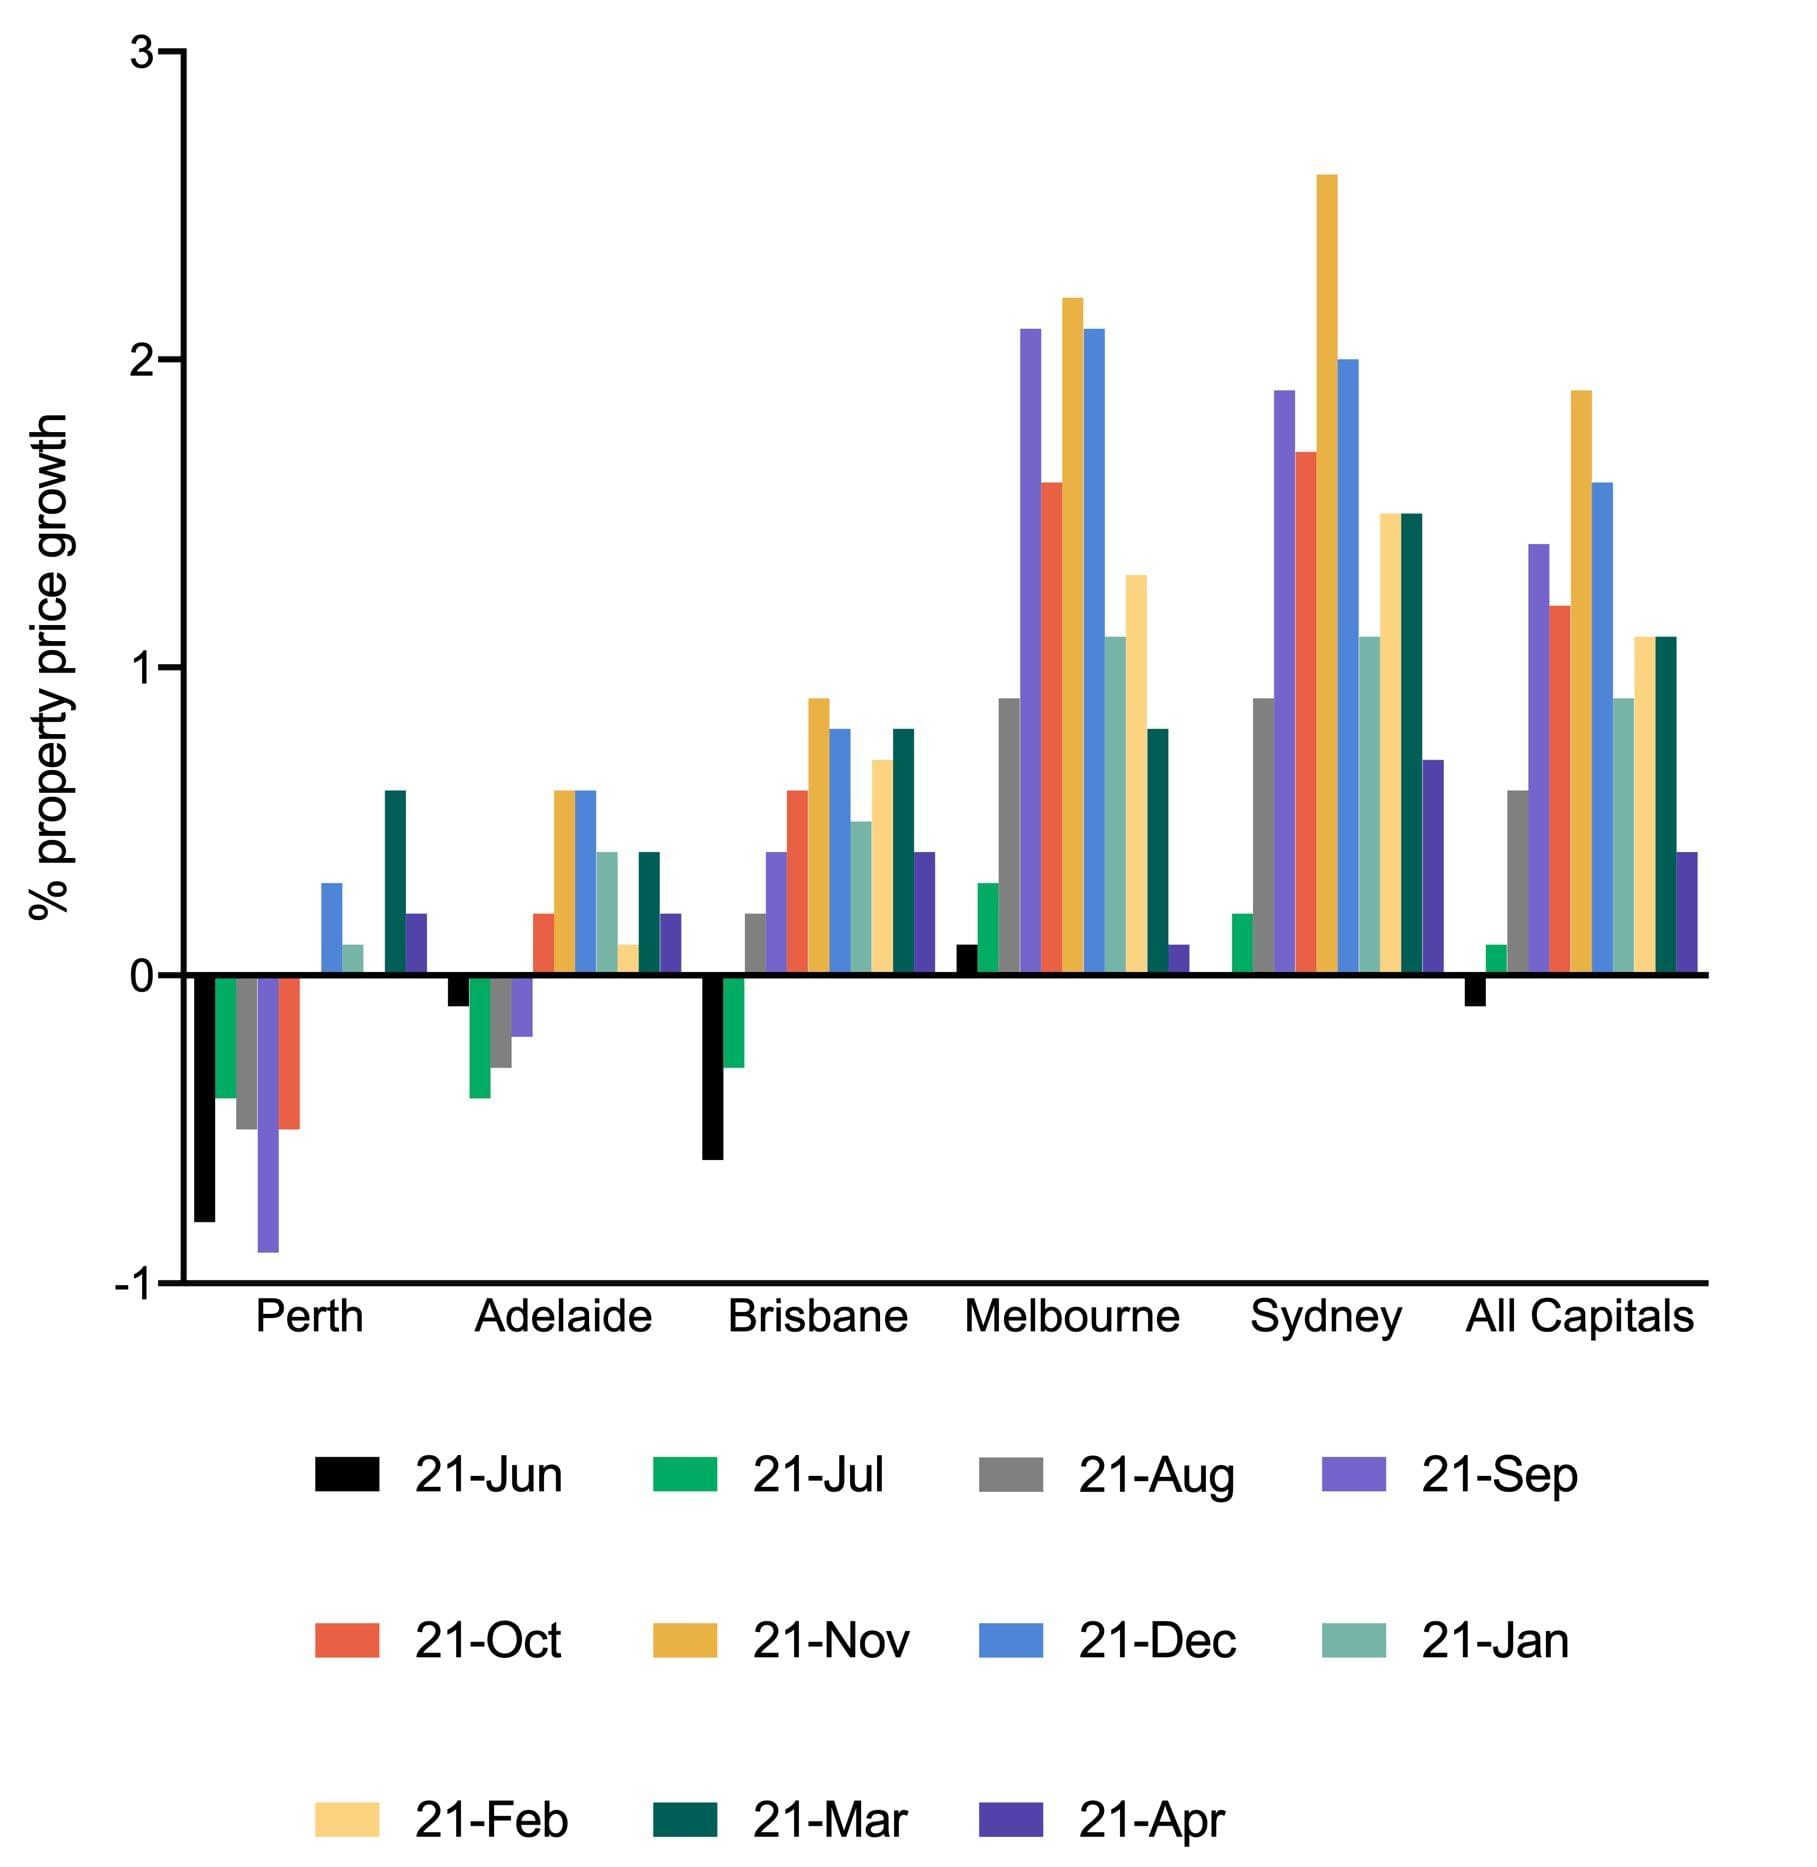
While growth has slowed, for now all capital cities above have maintained positive price growth for the last six months.
In the last month, most capital cities (except for Perth) recorded positive growth of less than 0.5%. Since this is a national (and worldwide) pandemic, all markets seem to have been affected in a similar way.
What does this mean for the future?
As we know, the faster the virus is contained and Australia can return its operations to some level of normalcy, the less chance we have of a sustained recession. While social distancing measures felt swift and sudden, we can now see how well these measures are working.
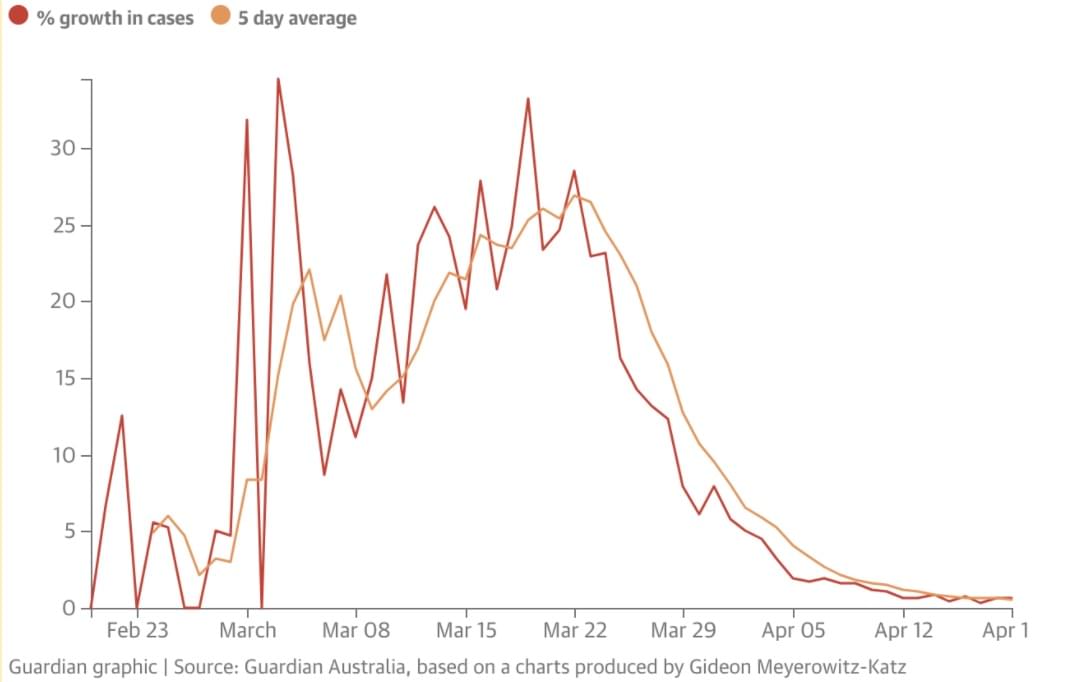
New reported Covid-19 cases are slowing day by day, South Australia has had three days of no new cases, and yesterday there were no new cases in Queensland, Western Australia or South Australia. In addition, we saw some loosening of restrictions in our health sector, with Prime Minister Scott Morrison lifting the ban on elective surgeries. It seems that progress so far is looking very promising.
According to SQM Research property analyst Louis Christopher, the best case scenario for homeowners is that we get to zero Covid-19 cases before April is over with. He believes there's a 50% chance that our three major states will record zero new Covid-19 cases in a day before the month is over.
“If we get to that point, the next question begs how long will restrictions be kept? Potentially some restrictions could be lifted in May.
“My bet is that when restrictions are eventually lifted, they will be lifted in the reverse order that they were placed on to begin with.
“As the ban on auctions occurred as one of the last stages, it is quite feasible that lifting that ban could come sooner than expected,” Mr Christopher said.
If the market can return to some level of normal operation, even if some social distancing measures are still enforced, then confidence in the housing market is likely to return.
Ms Leah Calnan, President of the Real Estate Institute of Victoria, echoes similar sentiments.
“if we can get through this and into spring then we should see the market return. People need to have property transactions,” she said.
CoreLogic’s analysts are even exhibiting a bit of optimism around property values, stating that even though stocks have hit 30 year lows, it’s unlikely that housing values will suffer the same fate. Indeed, the recent interest rate cuts and billions of dollars in government fiscal measures will help to keep property values insulated from a major crash.
According to Eliza Owen, CoreLogic’s Head of Australian Research, the housing market has a history of performing well after economic shocks compared to the volatile share market. So it’s not all doom and gloom.
What if you need to sell?
If you need to sell your property for whatever reason, it’s still entirely possible and sellers are still reporting fantastic results. You just need to understand that conditions are going to be a little bit weaker.
While transaction volumes are lower, there are still buyers out there, and lending rates are the lowest they’ve ever been. Our daily conversations with agents tell us (anecdotally) that well-presented properties that are priced reasonably are still selling.
To help you on your way, we’ve also created these helpful articles and guides should you need to sell in the current market:


