Disclaimers

Monthly property report

Where did this data come from?
All data is sourced from RP Data Pty Ltd trading as CoreLogic.
An automated valuation model estimate (AVM Estimate) is a statistically derived estimate of the sale or rental value (as the context requires) of the subject property. An AVM Estimate is generated (i) by a computer driven mathematical model in reliance on available data; (ii) without the physical inspection of the subject property; (iii) without taking into account any market conditions (including building, planning, or economic), and/or (iv) without identifying observable features or risks (including adverse environmental issues, state of repair, improvements, renovations, aesthetics, views or aspect) which may, together or separately, affect the value. An AVM Estimate is current only at the date of publication or supply.
An AVM Estimate must not be relied upon as a professional valuation or an accurate representation of the market sale or rental value of the subject property. CoreLogic expressly excludes any warranties and representations that an AVM Estimate is an accurate representation as to the market sale or rental value of the subject property. To the full extent permitted by law, OpenAgent, excludes all liability for any loss or damage howsoever arising or suffered by the recipient, whether as a result of the recipient's reliance on the accuracy of an AVM Estimate or otherwise arising in connection with an AVM Estimate.
Help me understand the data
Change in value (12 months) : The percentage difference between the median AVM value in the same period compared 12 months ago.
Total sales (1 month) : A count of all transactions over the last month.
Median days on market (12 months) : The median number of days it has taken to sell those properties sold by private treaty during the last 12 months. The calculation excludes auction listings and listings where an asking price is not advertised. The days on market calculation uses the contract date on the property compared with the first advertised date.
Median sale price (3 months) : The median sale price of all transactions recorded during the 3 month period. Note that sale prices lower than $10,000 and higher than $100,000,000 are excluded from the analysis.
Why is it showing an old photo of my property?
The image shown is from CoreLogic and is the latest availble to us at the time. We are unable to change the image shown.
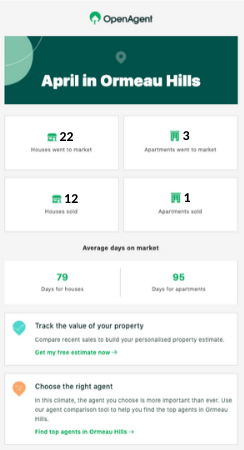
Monthly real estate results
Where did this data come from?
All data is sourced from RP Data Pty Ltd trading as CoreLogic.
Help me understand the data
Went to market: The total unique number of properties that have been advertised for sale and captured over the past month.
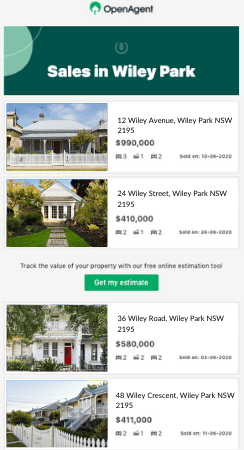
Sold: A count of all transactions over the last month.
Average days on market: The average number of days it has taken to sell those properties sold by private treaty during the last 12 months. The calculation excludes auction listings and listings where an asking price is not advertised. The days on market calculation uses the contract date on the property compared with the first advertised date.
Recent property sales
Where did this data come from?
All data is sourced from RP Data Pty Ltd trading as CoreLogic.