Email & Website Data Disclaimers
This page explains where the data in our email communications and website comes from. We want to be transparent so you can trust the accuracy and reliability of the information we share.
These disclaimers will outline any third-party partnerships, data sources, or limitations that might affect the information in our emails and information on the website generally. Our goal is to ensure you have a clear understanding and can make informed decisions.
Please be aware that the images provided on this page are for illustrative purposes only. They serve as examples only, and should not be considered an accurate depiction of any actual property or data.
If you have any questions, please contact newsletter@openagent.com.au.
Where Does Your Data Come From?
The information is drawn from data held by OpenAgent and Australian Property Monitors Pty Limited ACN 061 438 006 (trading as, “Domain Insight”), a subsidiary of Domain Holdings Australia Limited ABN 43 094 154 364 (Domain). While the data used is regularly updated, it may still be limited, outdated, or incomplete.
OpenAgent data comes from qualitative and quantitative user-generated sources. These include user registrations and feedback, as well as our detailed analysis of property listings and sales documents. This data represents the combined understanding of users on the OpenAgent platform, providing information on real estate trends, agent performance, and market activity.
Domain information is published and compiled by Domain Insight, which relies on data supplied by a variety of external sources in its development. While Domain Insight strives for accuracy, the information may be subject to errors or omissions due to reliance on third-party data.
Overall, this data offers a general overview of property information and real estate activity in the suburb, but should not be considered a comprehensive or definitive representation of property value, market demand or supply. Neither OpenAgent nor Domain guarantees the accuracy, completeness, or currency of this information. To the fullest extent permitted by law, both parties disclaim all warranties and exclude any liability for loss or damage arising from reliance on this data. Use this information at your own risk.
All price estimates (Estimates) are computer-generated and rely on data from Domain, with results based on OpenAgent user-provided inputs, which may be outdated, limited, and unverified. Estimates are not professional valuations and may differ significantly from actual sale prices.
Property reports are also computer-generated, combining data from OpenAgent and Domain. These reports are intended as general information and should not be relied upon as professional valuations or appraisals.
It's important to understand that automated price estimates and property reports provide a general indication of value but don't capture all the critical elements that determine a property's actual sale price. Several key factors can cause a final sale price to differ from these initial estimates:
- Property Condition: The condition of the property, including its age, layout, maintenance, and any recent improvements, significantly impacts its value. As these details are not included in automated reports, the true market value can vary.
- Current Market Conditions: The property market is constantly changing, influenced by factors like interest rates and supply and demand. Estimates typically rely on past data and may not reflect the latest market changes or local trends that can affect property values at the time of sale.
- Individual Circumstances: The unique motivations of buyers and sellers, such as urgency to sell or negotiation tactics, can also play a significant role in the final selling price.
Therefore, it's best to use price estimates and property reports as helpful starting points rather than definitive predictions or guarantees of a property's eventual sale price. For an accurate property and market assessment, we strongly recommend consulting a licensed real estate agent.
Help Me To Understand Monthly Suburb Statistics

On the market: The total number of unique properties that have been advertised for sale and captured over the last month. It represents the properties currently available in the market.
Sold: A count of all property transactions over the last month. It represents the volume of properties sold during the specified period.
Average days on market: The average number of days it has taken to sell those properties sold by private treaty during the last 12 months. The calculation excludes auction listings and listings where an asking price is not advertised. The days on market calculation uses the contract date on the property compared with the first advertised date. It provides an insight into the typical selling timeframe in the area.
Help Me To Understand the Monthly Property Report
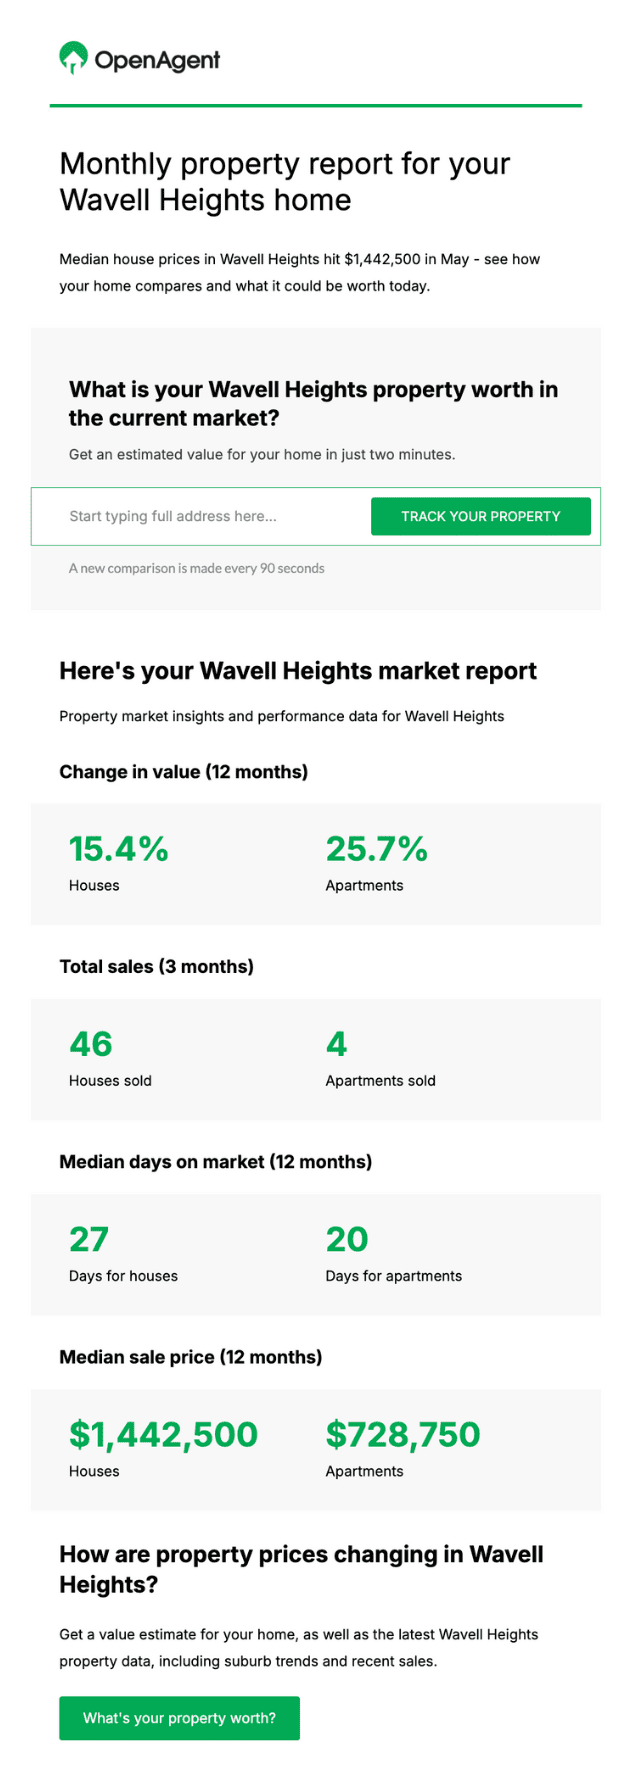
Change in value (12 months): The percentage difference between the median sale price in the current period compared to the same period 12 months ago.
Total sales (3 months): A count of all property transactions over the last 3 months.
Median days on market (12 months): The median number of days it has taken to sell those properties sold by private treaty during the last 12 months. The calculation excludes auction listings and listings where an asking price is not advertised. The days on market calculation uses the contract date on the property compared with the first advertised date.
Median sale price (12 months): The median sale price of all transactions recorded during the 12 month period. Note that sale prices lower than $10,000 and higher than $100,000,000 are excluded from the analysis.
Help Me To Understand the Quarterly Market Update

Median sale price: The median sale price of all transactions recorded during the 3 month period. Note that sale prices lower than $10,000 and higher than $100,000,000 are excluded from the analysis.
Change in median sale price: The percentage difference between the median sale price in the current period compared to the same period 3 months ago.
Total listings: A count of all property listings over the last 3 months.
Total sales: A count of all property transactions over the last 3 months.
Median days on market: The median number of days it has taken to sell those properties sold by private treaty during the last 3 months. The calculation excludes auction listings and listings where an asking price is not advertised. The days on market calculation uses the contract date on the property compared with the first advertised date.
Help Me To Understand Market Trends
Median sale price: The median sale price of all transactions recorded during the 12 month period. Note that sale prices lower than $10,000 and higher than $100,000,000 are excluded from the analysis.
Annual change: The percentage difference between the median sale price in the current period compared to the same period 12 months ago.
Median days on market: The median number of days it has taken to sell those properties sold by private treaty during the last 12 months. The calculation excludes auction listings and listings where an asking price is not advertised. The days on market calculation uses the contract date on the property compared with the first advertised date.
Total sales: A count of all property listings over the last 12 months and the percentage difference in the current period compared to the same period 12 months ago.
Total sales: A count of all property transactions over the last 3 months and the percentage difference in the current period compared to the same period 12 months ago.
Why is it showing an old photo of the property?
Please be aware that the property image you are currently viewing is provided by Domain and is the most up-to-date version we had access to at the time of publishing.
It's important to note that once an image is displayed, we cannot make any modifications or updates to it. In situations where a specific property image isn't available, we will use a standard image of a sold property sign as a temporary placeholder. While we strive to ensure the images are accurate and relevant, we cannot guarantee they will always reflect the very latest changes.
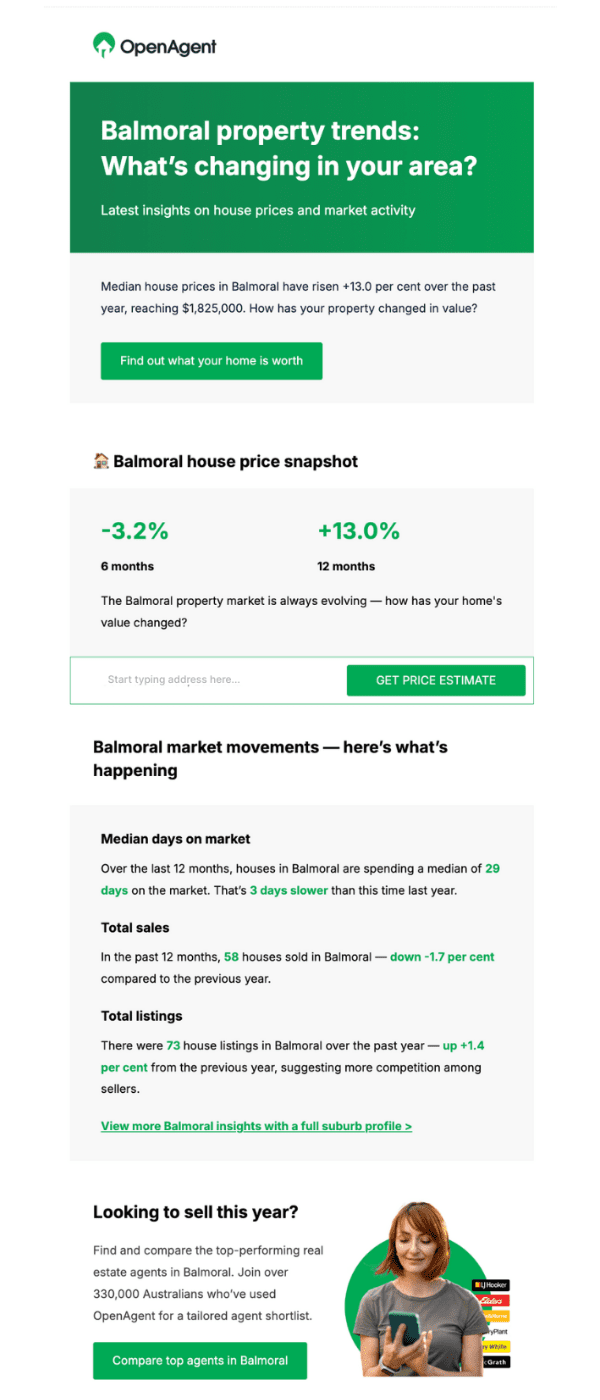
Help Me To Understand Past 12 Months Suburb Performance
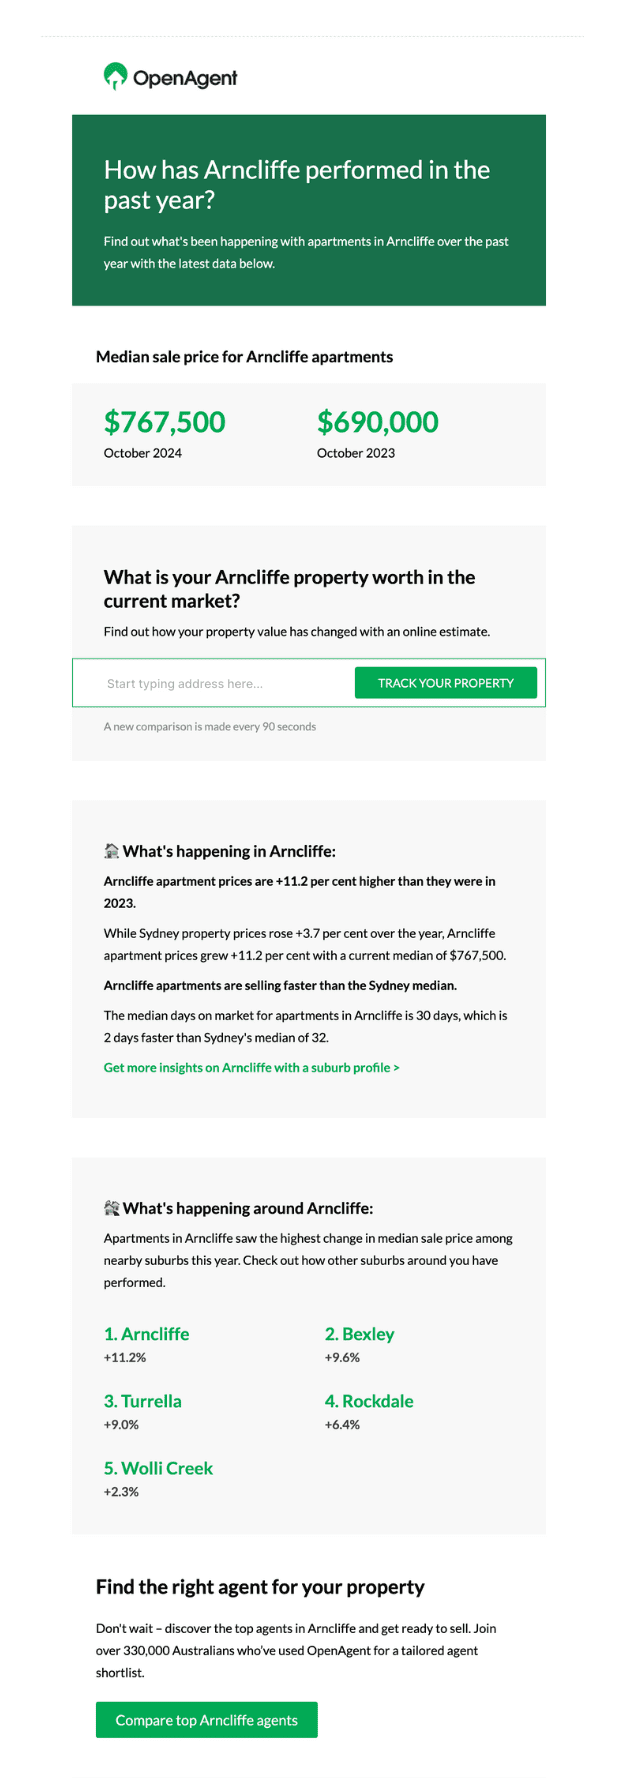
Median sale price: The median sale price of all transactions recorded during the 12 month period. Note that sale prices lower than $10,000 and higher than $100,000,000 are excluded from the analysis.
Change in median sale price: The percentage difference between the median sale price in the current period compared to the same period 12 months ago.
Median days on market: The median number of days it has taken to sell those properties sold by private treaty during the last 12 months. The calculation excludes auction listings and listings where an asking price is not advertised. The days on market calculation uses the contract date on the property compared with the first advertised date.
Nearby suburb comparison: Suburbs located within a [x] km radius that have recorded the highest change in median sale price over the past 12 months, compared to the same period one year ago.
Help Me To Understand Median Days on Market
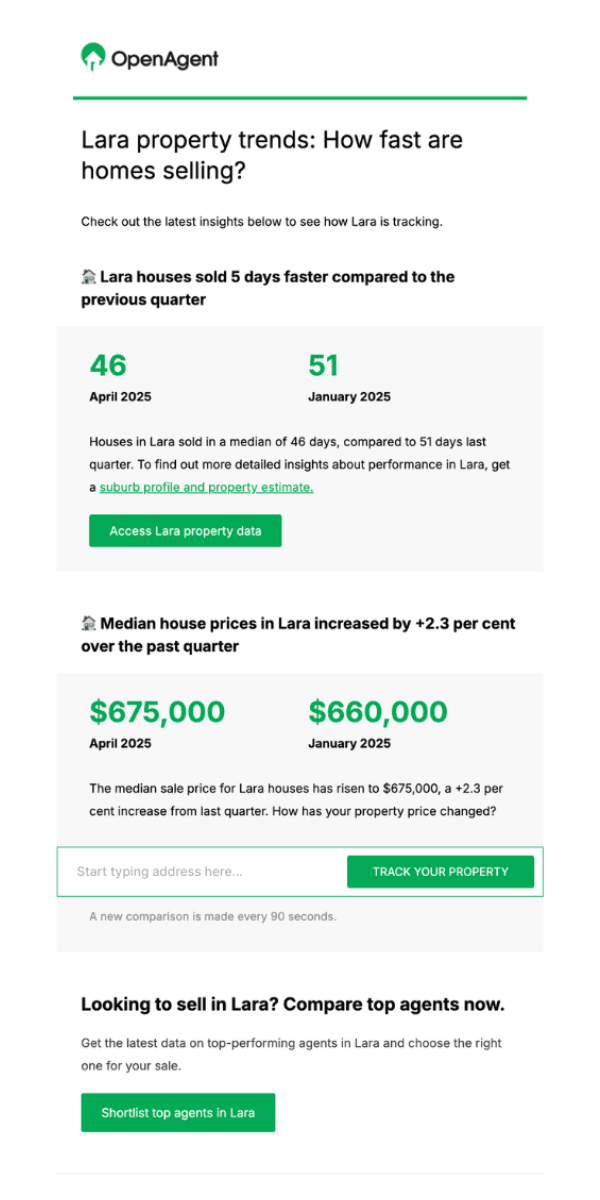
Median days on market: The median number of days it has taken to sell those properties sold by private treaty during the last 3 months. The calculation excludes auction listings and listings where an asking price is not advertised. The days on market calculation uses the contract date on the property compared with the first advertised date.
Change in median days on market: The difference between the median days on market in the current period compared to the same period 3 months ago.
Median sale price: The median sale price of all transactions recorded during the 12 month period. Note that sale prices lower than $10,000 and higher than $100,000,000 are excluded from the analysis.
Change in median sale price: The percentage difference between the median sale price in the current period compared to the same period 12 months ago.
Help Me To Understand Quarterly Price Increase Alerts
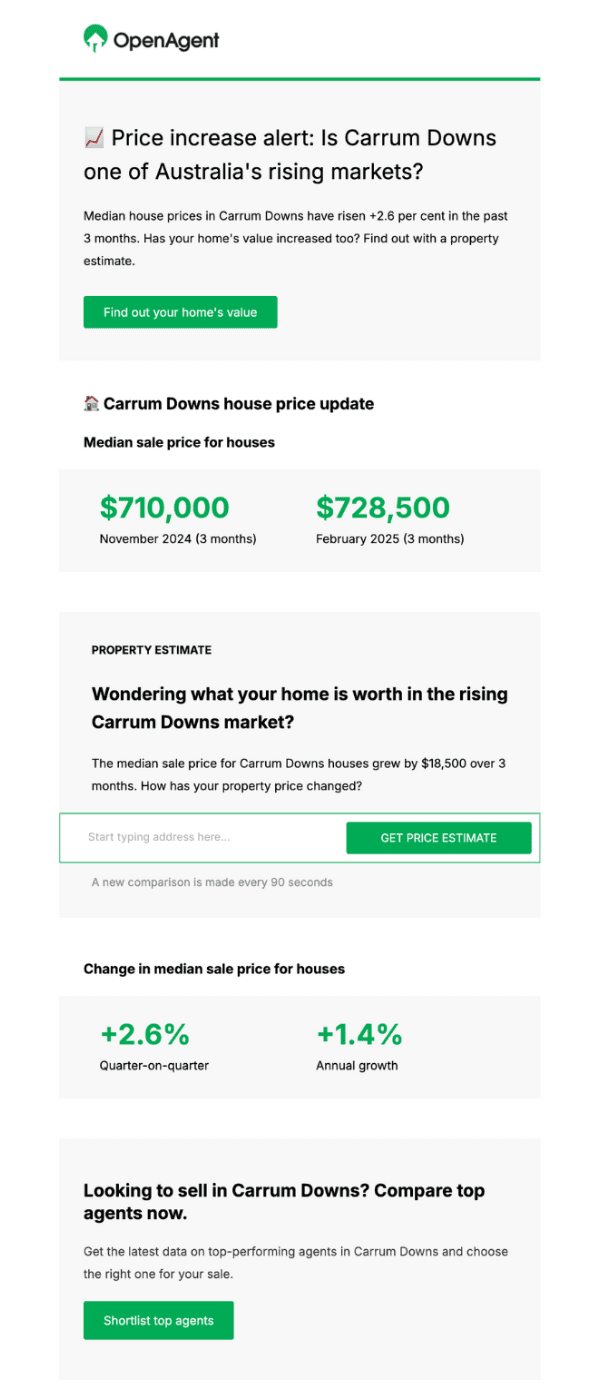
Median sale price: The median sale price of all transactions recorded during the 3 month period. Note that sale prices lower than $10,000 and higher than $100,000,000 are excluded from the analysis.
Quarter-on-quarter change in median sale price: The percentage difference between the median sale price in the current period compared to the same period 3 months ago.
Annual change in median sale price: The percentage difference between the median sale price in the current 12 month period compared to the same period 12 months ago.