
 - https://sketchapp.com --%3e %3ctitle%3eIcon/search%3c/title%3e %3cdesc%3eCreated with Sketch.%3c/desc%3e %3cg id='Icon/search' stroke='none' stroke-width='1' fill='none' fill-rule='evenodd' stroke-linecap='round' stroke-linejoin='round'%3e %3ccircle id='Oval' stroke='%23252525' cx='10.5145111' cy='10.5145111' r='6.99455261'%3e%3c/circle%3e %3cpath d='M15.4908752%2c15.4908752 L20.5515137%2c20.5515137' id='Line' stroke='%23252525'%3e%3c/path%3e %3c/g%3e%3c/svg%3e)


Sydney property market news - key takeaways
- Sydney property market values fall further: Sydney dwelling values declined -1.4 per cent in August 2026 and are now -7.1 per cent below the February 2026 peak, with houses falling at a steeper rate than units.
- Stock builds as new listings dry up: Total listings rose +11.3 per cent year on year while new listings dropped -18.8 per cent, meaning existing stock is sitting longer and giving buyers more choice without fresh supply arriving.
- Auctions favour buyers: Sydney's auction clearance rate of 52.5 per cent across 501 auctions sits in territory that favours buyers, with one in five scheduled properties withdrawn before bidding began.
- Rental growth moderates as vacancy rises: Annual rents grew +4.8 per cent in Sydney, below the national pace, while the vacancy rate edged up to 1.7 per cent from 1.4 per cent a year ago, easing some pressure on tenants.
- Rate rise on the horizon: All four major banks expect another 25 basis point hike to 4.60 per cent, with NAB forecasting a move as soon as September 2026, adding further pressure to borrowing capacity in an already expensive market.

Get a free property value estimate
Find out how much your property is worth in today’s market.
Sydney property price movements
Sydney's property market recorded further price falls in August 2026, extending a decline that has now gathered meaningful pace over the quarter and the year. Values have fallen across all property types, with houses absorbing steeper losses than units.
Sydney property prices - August 2026
Sydney home values fell -1.4 per cent in August 2026, with the quarterly and annual figures both moving deeper into negative territory at -4.7 per cent and -4.6 per cent respectively. The quarterly decline in particular shows how sharply conditions have shifted since the start of the year.
| Property type | Current median price | Monthly change | Quarterly change | Annual change |
|---|---|---|---|---|
| All Sydney dwellings | $1,222,718 | -1.4% | -4.7% | -4.6% |
Source: Cotality
The median home value in Sydney now sits at $1,222,718, down around $17,000 over the month. Values remain -7.1 per cent below their February 2026 peak, meaning the typical Sydney home has given back a substantial share of its earlier gains in a relatively short period.
House prices in Sydney
Sydney house prices fell -1.8 per cent in August 2026, a sharper monthly decline than the broader market, with the quarterly and annual figures at -5.4 per cent and -5.5 per cent respectively. The Sydney housing market has seen consistent and accelerating falls across all three time horizons.
| Property type | Current median price | Monthly change | Quarterly change | Annual change |
|---|---|---|---|---|
| Sydney houses | $1,494,878 | -1.8% | -5.4% | -5.5% |
Source: Cotality
The median house value fell to $1,494,878 in August 2026, a drop of around $27,300 over the month. The annual fall of -5.5 per cent is more pronounced than the equivalent figure for units, pointing to greater price pressure in the house segment, where values are concentrated at higher price points.
Unit prices in Sydney
Sydney unit prices edged lower by -0.4 per cent in August 2026, a notably smaller monthly decline than houses. The quarterly and annual figures for Sydney unit prices stand at -2.9 per cent and -2.3 per cent respectively, less than half the annual fall recorded for houses.
| Property type | Current median price | Monthly change | Quarterly change | Annual change |
|---|---|---|---|---|
| Sydney units | $878,176 | -0.4% | -2.9% | -2.3% |
Source: Cotality
The median unit value dipped to $878,176 in August 2026, down around $3,500 over the month. Units have held up considerably better than houses over both the quarter and the year, with the annual gap between the two segments now exceeding three percentage points.
Sydney property market forecasts 2026
Australia's Big Four banks, CBA, Westpac, NAB, and ANZ, publish annual dwelling price forecasts as part of their economic research. Views on the Sydney house price forecast for 2026 vary considerably across the four, with every bank expecting values to fall further over the calendar year.
- CBA predicts Sydney property prices to fall -6.0 per cent over 2026.
- Westpac predicts Sydney property prices to fall -3.0 per cent over 2026.
- NAB predicts Sydney property prices to fall -10.0 per cent over 2026.
- ANZ predicts Sydney property prices to fall -9.9 per cent over 2026.
Westpac sits at the more moderate end of the Sydney property market predictions, forecasting a -3.0 per cent decline, while NAB (-10.0 per cent) and ANZ (-9.9 per cent) represent the more pessimistic end of the range. CBA's -6.0 per cent forecast places it closer to the middle of the spread, though still well above the Westpac position.
RBA cash rate forecast 2026-2027
The cash rate currently sits at 4.35 per cent, having risen sharply from 3.6 per cent in the period preceding. All four major banks expect the next move to be a further rise, though they differ on timing, with NAB the most immediate in its outlook and the others pointing to November 2026.
- ANZ expects the next cash-rate move to be a 25 basis point rise, bringing the cash rate to 4.60 per cent.
- CBA expects the next cash-rate move to be a 25 basis point rise, bringing the cash rate to 4.60 per cent.
- NAB expects the next cash-rate move to be a 25 basis point rise in September 2026, with the risk of a further rise in November 2026 to bring the cash rate to 4.60 per cent.
- Westpac expects the next cash-rate move to be a 25 basis point rise, bringing the cash rate to 4.60 per cent.
Sally Tindall, Data Insights Director at Canstar, said of the rate outlook: "The economic narrative has taken a U-turn in the space of just a couple of days."
Tindall's observation captures precisely the uncertainty facing Sydney borrowers right now: a rate environment that was shifting in one direction has reversed course quickly, making forward planning harder than it has been at almost any point in recent memory.
What this means for the Sydney market
A cash rate at 4.35 per cent already represents a significant constraint on borrowing capacity in Australia's most expensive housing market, where the median dwelling value sits above $1,200,000. Any further rise to 4.60 per cent would reduce what buyers can borrow at a time when values have already fallen -7.1 per cent from their February 2026 peak.
The combination of a rising rate path and a wide forecast range, from -3.0 per cent to -10.0 per cent, tells Sydney buyers and sellers that the scale of further falls is genuinely uncertain. Units, with a smaller median value of $878,176 and a shallower quarterly decline than houses, may be somewhat less exposed to rate-driven affordability pressure than the house segment, where the median has already dropped to $1,494,878.
First-home buyers targeting more affordable price points may find conditions more navigable than upgraders carrying existing mortgages into a market that continues to ease.
Helpful resource: Our simple guide to tracking market trends and data will walk you through everything you need to know to be able to read the market and make a smarter selling decision.
Sydney house prices graphs and charts
Sydney's house price growth over the last 5 years has seen values rise sharply through 2021 and into early 2022, recover briefly in late 2023 and 2024, and then fall for a sustained stretch into 2026, with dwelling values now sitting -1.4 per cent lower over the month, -4.7 per cent over the quarter, and -4.6 per cent over the year to August 2026, leaving the current median at $1,222,718, according to Cotality's latest figures. That February 2026 peak now sits 7.1 per cent above where values are today, meaning the city has given back a meaningful portion of its post-pandemic gains in a relatively short period.
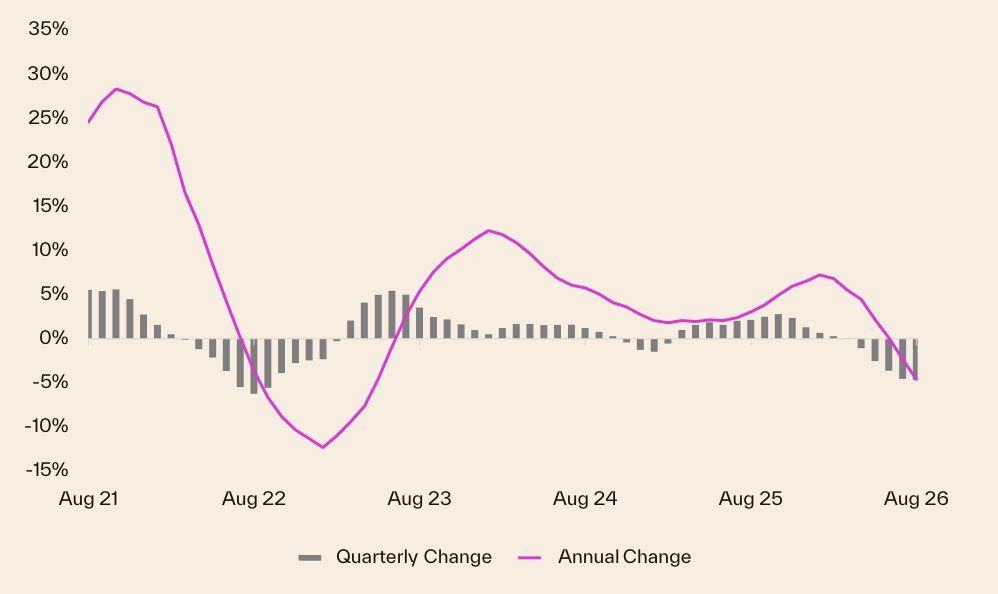
The pressure on values reflects a combination of forces that have been building across the five-year period: the cash rate rising from historic lows to 4.35 per cent, a material shift in buyer demand, and a build-up of total stock sitting on the market well above year-ago levels. With the major banks expecting at least one further rate rise before the end of 2026, the weight on buyer capacity that has driven the quarterly decline looks set to persist into the spring selling season.
Sydney property 30 year property price graph
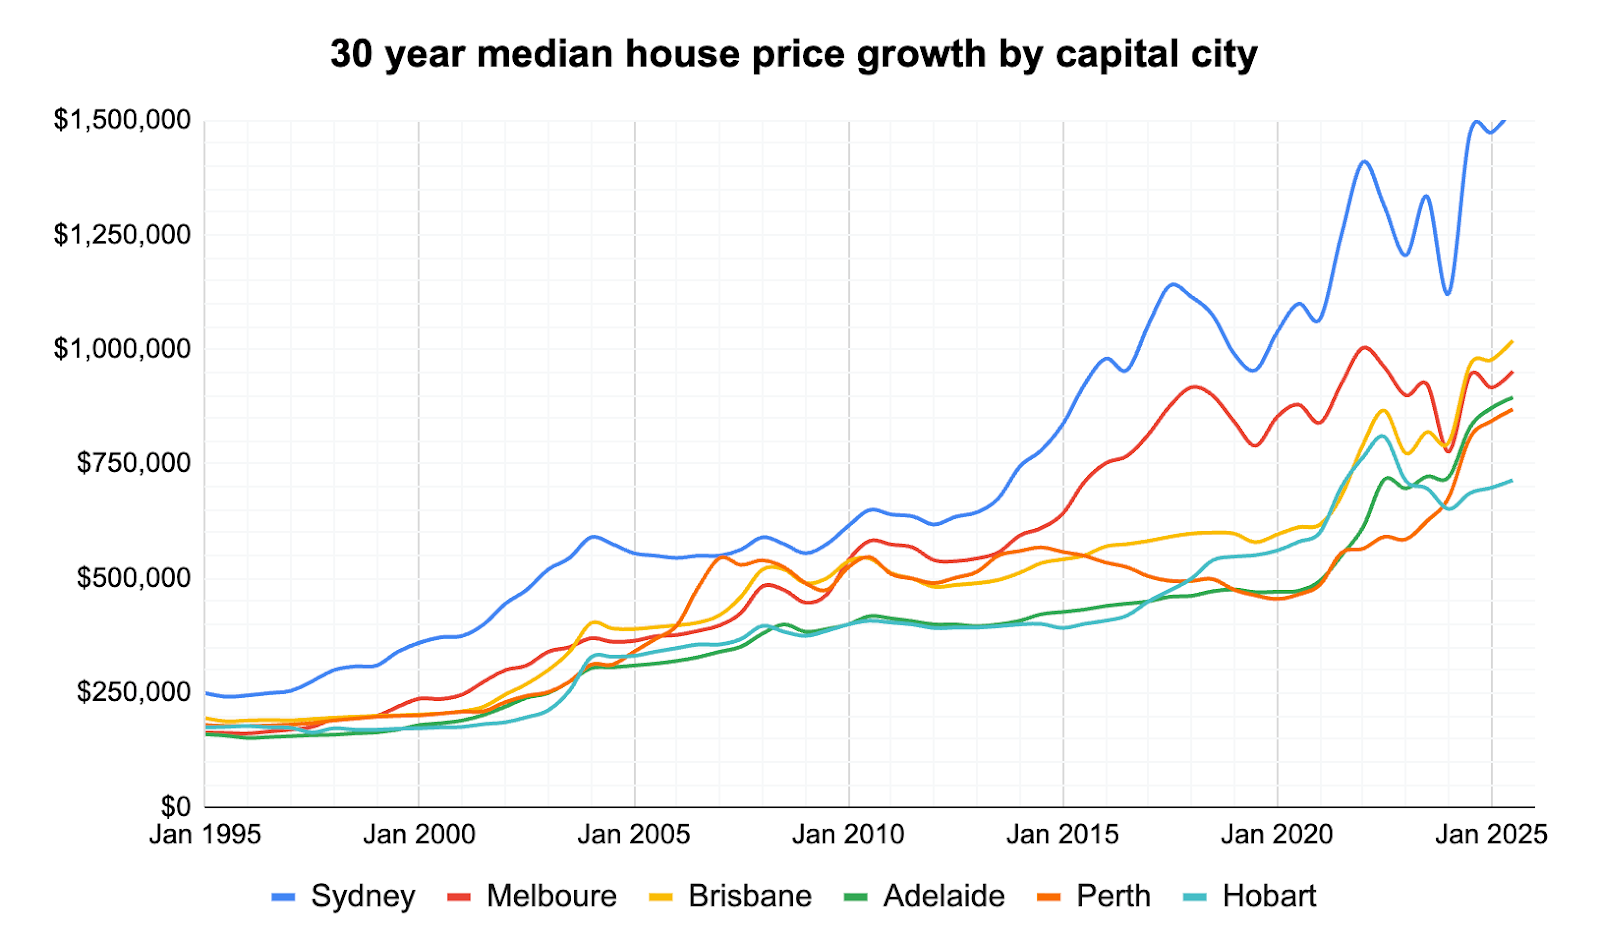
Sydney property prices growth over the last 10 years has been strong overall: a large upswing into 2021 was followed by a correction in 2022 and a steady rebuild of momentum through 2023–2025, demonstrating long-run demand, tight supply and the outsized role of interest-rate moves in recent cycles.
Over the past three decades Sydney has recorded some of the biggest cumulative gains in Australia, but the path has been boom–bust–recovery cycles driven by changes in credit, investor activity and population growth; today homeowners feel more cautious than in 2021 while many buyers are still watching rates and affordability, balancing a desire to buy with a need for certainty about repayments and timing.
Sydney selling statistics
Sydney's selling conditions in August 2026 present a clear picture: fewer transactions, longer selling times, and more accumulated stock weighing on the market. Sellers are taking more time to find buyers, and when sales do occur, the gap between asking price and final sale price has widened from a year ago.
Want to know what your own property is worth? Get a free value estimate for your address.
Sydney sales volume and days on market
Sales volumes in Sydney fell -5.3 per cent year on year in August 2026, while properties took an average of 45 days to sell, up from 32 days a year earlier.
| Sydney sales volume | Sydney days on market |
|---|---|
| -5.3% Change from 12mo ago | 45 days 32 days 12 mo ago |
Source: Cotality
Sydney's -5.3 per cent sales volume decline is broadly in line with the combined capitals figure of -5.2 per cent, though both sit noticeably weaker than the national figure of -2.7 per cent, suggesting conditions in capital city markets have softened more sharply than the country as a whole.
At 45 days, Sydney's average time on market is 8 days longer than the combined capitals average of 37 days and 6 days longer than the national average of 39 days, pointing to a buyer pool that is taking longer to commit at current price levels.
Sydney new and total listings
New listings in Sydney dropped -18.8 per cent year on year, a sharp pullback that points to sellers choosing to hold off rather than test the market in current conditions. At the same time, total listings rose +11.3 per cent over the same period.
| Sydney new listings | Sydney total listings |
|---|---|
| -18.8% Change from 12mo ago | +11.3% Change from 12mo ago |
Source: Cotality
The combination tells a specific story: fewer sellers are bringing fresh property to market, but slower transaction activity means existing stock is sitting longer and accumulating. The result is more choice for buyers, and more competition among the properties already listed, which adds further downward pressure on prices in a market where values have already been falling.
Sydney vendor discount and auction clearance rates
Vendor discount measures the percentage difference between the initial asking price and the price a property ultimately sells for, giving a practical sense of how much sellers are adjusting their expectations to meet buyers.
Auction clearance rate captures what share of properties taken to auction actually sell on the day, which reflects how active and confident buyers are when competing for stock in real time. Together these two measures give a rounded view of negotiating conditions across Sydney's market.
Sydney vendor discount
| August 2026 | August 2025 | |
|---|---|---|
| Sydney median vendor discount | -4.5% | -3.2% |
Source: Cotality
Sydney's vendor discount widened to -4.5 per cent in August 2026, compared with -3.2 per cent a year earlier. That 1.3 percentage point shift means sellers are now accepting offers further below their initial asking price than they were at the same point last year, consistent with the slower sales pace and rising stock levels seen across the city.
Sydney auction clearance rates
| Sydney | 6 Sept 2026 |
|---|---|
| Total Auctions | 501 |
| Sold | 263 |
| Withdrawn | 105 |
| Passed in | 133 |
| Clearance Rate | 52.5% |
Source: Cotality
Sydney recorded a clearance rate of 52.5 per cent across 501 auctions in the week ending 6 September 2026, with 263 properties sold and 133 passed in. A rate in the low fifties sits in territory that favours buyers, well below the roughly 65 per cent level that characterises a balanced market.
The volume of withdrawn properties, 105, or around one in five of all scheduled auctions, suggests a portion of vendors are choosing to defer rather than accept prices below their reserve.
Thinking of selling? Compare top-performing local agents in your suburb to find the right fit for your sale.
Get a deeper insight into how Sydney sellers are faring in 2026 and what could be on the horizon for the the year ahead with some of our latest articles.




Sydney property investing
Sydney's rental market is producing steady income growth for landlords, but the city's high property values continue to compress yields relative to other parts of the country. For renters, conditions remain tight by historical standards even as vacancy has eased from where it was a year ago.
Helpful resource: Estimate the capital gains tax on a sale with our free calculator.
Sydney rental market
The table below covers annual rent growth and gross rental yield for Sydney alongside other capitals and national aggregates, with the house and unit breakdown shown where available.
| Location | Rental rates | Rental yield | Annual change in rents, houses | Annual change in rents, units |
|---|---|---|---|---|
| National | 5.7% | 3.8% | NA | NA |
| Combined Capitals | 5.7% | 3.6% | NA | NA |
| Combined Regional | 5.8% | 4.3% | NA | NA |
| Sydney | 4.8% | 3.3% | 5.3% | 3.9% |
| Melbourne | 5.0% | 4.0% | 5.1% | 4.9% |
| Brisbane | 6.4% | 3.4% | 6.7% | 5.6% |
| Adelaide | 5.8% | 3.6% | 5.8% | 6.0% |
| Perth | 8.0% | 3.9% | 8.1% | 7.4% |
| Hobart | 7.9% | 4.4% | 8.5% | 6.0% |
| Darwin | 11.4% | 6.3% | 12.0% | 10.5% |
| Canberra | 3.2% | 4.3% | 4.0% | 1.4% |
Source: Cotality
Sydney rents rose +4.8 per cent over the year, with houses gaining more (+5.3 per cent) than units (+3.9 per cent). The city's gross yield of 3.3 per cent is the lowest of any capital, which tells you less about rents and more about how far Sydney values have run: the income stream is growing, but the purchase price is simply very high relative to what a property earns each week.
Sydney vacancy rates
The vacancy rate is a measure of how many rental properties are sitting empty at any given time. A low rate signals strong competition among renters; a rising rate means more choice and, usually, less upward pressure on rents. SQM data shows that Sydney's vacancy rate has risen from 1.4 per cent a year ago to 1.7 per cent in August 2026.
| Location | Aug 2026 vacancy rates | Aug 2026 vacancies | Aug 2025 vacancy rates | Aug 2025 vacancies |
|---|---|---|---|---|
| National | 1.3% | 41,039 | 1.2% | 37,742 |
| Sydney | 1.7% | 12,821 | 1.4% | 10,211 |
| Melbourne | 1.8% | 9,534 | 1.8% | 9,620 |
| Brisbane | 0.9% | 3,090 | 1.0% | 3,423 |
| Adelaide | 0.6% | 1,019 | 0.8% | 1,257 |
| Perth | 0.6% | 1,192 | 0.7% | 1,389 |
| Hobart | 0.6% | 158 | 0.5% | 144 |
| Darwin | 0.4% | 94 | 0.5% | 134 |
| Canberra | 2.1% | 1,264 | 1.6% | 978 |
Source: SQM Research
Sydney's vacancy rate of 1.7 per cent sits above the national rate of 1.3 per cent and has risen by 0.3 percentage points over the year, with the number of empty properties climbing from 10,211 to 12,821. That shift places Sydney among the markets with more available rental stock, in contrast to Brisbane, Adelaide and Perth where vacancies have fallen year on year.
Louis Christopher, Managing Director at SQM Research said in the latest rental market report:
"The national vacancy rate is 1.3%, but that hides a market moving in two directions. Sydney has 26% more vacancies than a year ago and Canberra 29% more, while Brisbane, Perth, Adelaide and Darwin have fewer than they did last August."
Mr Christopher's observation maps directly onto what the Sydney data shows: the city is tracking with Canberra as an outlier on vacancy growth, pulling in the opposite direction to the tighter markets further north and west. For investors, a rising vacancy rate means more competition for tenants and less upward pressure on asking rents, which, combined with Sydney's already low gross yield, points to a more measured rental income outlook heading into summer.
Highest growth areas in Sydney
Sydney's top-performing SA3 regions in August 2026 were concentrated in the city's outer west, outer south-west and the Central Coast. The table below ranks the top 10 Statistical Area Level 3 (SA3) regions across Greater Sydney by annual percentage change; each SA3 is an Australian Bureau of Statistics geographic classification that typically groups several adjacent suburbs into a single statistical area.
| Rank | SA3 Name | SA4 Name | Median Value | Annual % Change |
|---|---|---|---|---|
| 1 | Wyong | Central Coast | $927,426 | 4.3% |
| 2 | Wollondilly | Outer South West | $1,156,340 | 4.3% |
| 3 | Richmond - Windsor | Outer West and Blue Mountains | $975,365 | 4.1% |
| 4 | Camden | Outer South West | $1,192,448 | 3.8% |
| 5 | Penrith | Outer West and Blue Mountains | $1,040,334 | 3.8% |
| 6 | Blue Mountains | Outer West and Blue Mountains | $1,001,062 | 2.1% |
| 7 | Campbelltown (NSW) | Outer South West | $967,625 | 2.1% |
| 8 | Fairfield | South West | $1,217,986 | 1.9% |
| 9 | Mount Druitt | Blacktown | $947,930 | 1.0% |
| 10 | St Marys | Outer West and Blue Mountains | $1,031,409 | 0.8% |
Source: Cotality
Highlights for Sydney’s high growth areas
- Wyong: Ranked #1 with annual growth of +4.3 per cent and a median value of $927,426, Wyong on the Central Coast led all Sydney SA3 regions in the year to August 2026. Relative affordability compared with the metropolitan core, combined with lifestyle appeal, has supported demand in suburbs such as Toukley and The Entrance.
- Wollondilly: Ranked #2, also with annual growth of +4.3 per cent and a median value of $1,156,340, Wollondilly in Sydney's Outer South West has attracted buyers seeking more land and space at a lower entry point than inner-city areas. Suburbs such as Picton and Bargo sit within this region and represent some of the city's more attainable larger-block options.
- Richmond - Windsor: Ranked #3 with annual growth of +4.1 per cent and a median value of $975,365, Richmond - Windsor in Sydney's far north-west continues to draw buyers for whom affordability relative to the broader city matters. Suburbs such as North Richmond and Windsor are established pockets within this region.
- South-west growth corridor: Ranks #4 and #5, Camden (+3.8 per cent, $1,192,448) and Penrith (+3.8 per cent, $1,040,334), both posted identical annual gains, reflecting sustained demand along Sydney's outer south-west and western corridors. In Camden, suburbs such as Narellan and Mount Annan have been active, while Glenmore Park and Jordan Springs represent busy pockets within Penrith.
- Outer-ring consolidation: Ranks #6 through #10, Blue Mountains (+2.1 per cent, $1,001,062), Campbelltown (NSW) (+2.1 per cent, $967,625), Fairfield (+1.9 per cent, $1,217,986), Mount Druitt (+1.0 per cent, $947,930) and St Marys (+0.8 per cent, $1,031,409), all recorded positive annual gains even as broader Sydney values fell, though the pace of growth was more modest. Suburbs such as Katoomba in the Blue Mountains and Rooty Hill in the Mount Druitt region sit within this band of outer-ring areas that have held relatively firm.
Thinking of selling or investing in Sydney? Compare local agents or get a free property report with OpenAgent.
View agent & property tools

Our powerful property tools


 - https://sketch.com --%3e %3ctitle%3eicons / icon-chevron-down%3c/title%3e %3cdesc%3eCreated with Sketch.%3c/desc%3e %3cg id='icons-/-icon-chevron-down' stroke='none' stroke-width='1' fill='none' fill-rule='evenodd'%3e %3crect id='Icon-container' x='0' y='0' width='24' height='24'%3e%3c/rect%3e %3cpolygon id='Shape' fill='%2300AB55' points='12 14.3357864 5.20710678 7.54289322 3.79289322 8.95710678 12 17.1642136 20.2071068 8.95710678 18.7928932 7.54289322'%3e%3c/polygon%3e %3c/g%3e%3c/svg%3e)