$500k-plus in six months: Australia's rapidly growing suburbs

Australia's property markets are off to a strong start in 2024 thanks to interest rate stability and ever-growing demand.
There are suburbs in every corner of the country that have delivered exceptional price growth over the past half-year thanks to great market conditions for sellers.
Here are Australia's top growth suburbs where homes have gained $100,000 in six months — and in many cases, a whole lot more.

Get a free property value estimate
Find out how much your property is worth in today’s market.
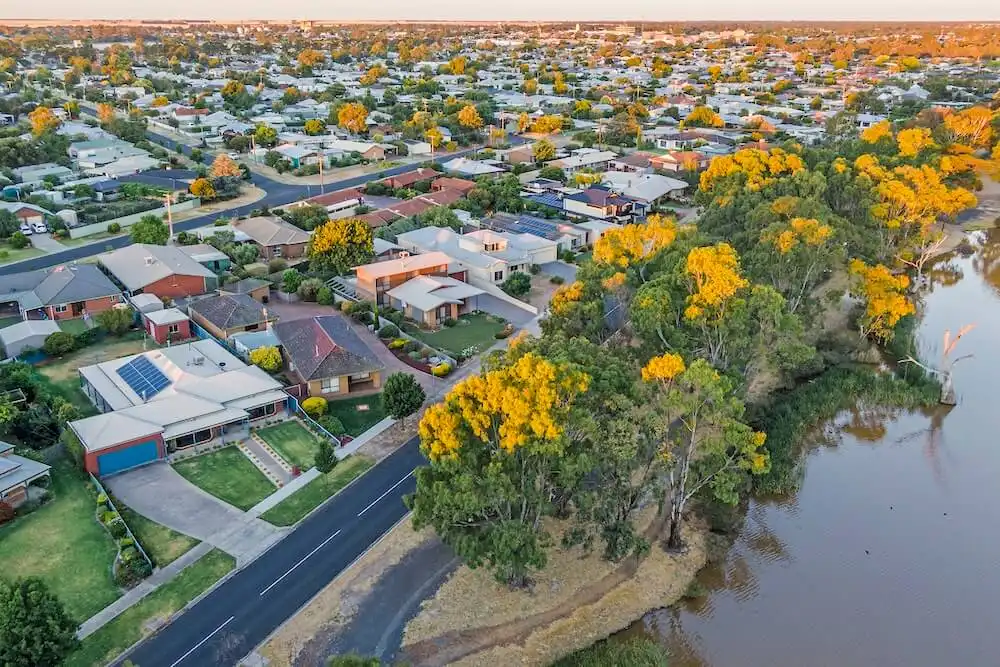
Sydney and New South Wales
While price gains in Sydney broadly eased off in the second half of 2023, annual growth still sits above a very healthy +10 per cent.
But there are dozens of suburbs across the state where gains have well and truly outpaced that rate over the past six months alone.
Sydney and NSW suburbs with $100k-plus growth in six months
Suburb Area Median price Feb23-Jul23 Median price Aug23-Jan24 Median price change Growth Farley Hunter Valley - Lower $485,000 $695,000 $210,000 43.3% Empire Bay Central Coast & Region $888,150 $1,250,000 $361,850 40.7% Sans Souci St George $1,820,000 $2,550,000 $730,000 40.1% Russell Lea Inner West $2,600,000 $3,540,000 $940,000 36.2% Forresters Beach Central Coast & Region $1,205,000 $1,635,000 $430,000 35.7% Gordon North Shore - Upper $3,000,000 $4,055,000 $1,055,000 35.2% North Wahroonga North Shore - Upper $2,150,000 $2,875,000 $725,000 33.7% Walcha New England - North West $350,000 $460,000 $110,000 31.4% Bonville Central Coast & Region $882,500 $1,135,000 $252,500 28.6% Wattle Grove Liverpool / Fairfield $1,038,500 $1,335,000 $296,500 28.6% Tralee Murray Region $609,900 $781,000 $171,100 28.0% Constitution Hill Parramatta $1,150,000 $1,460,000 $310,000 27.0% Mascot Eastern Suburbs $1,460,000 $1,850,000 $390,000 26.7% Woolooware Sutherland $2,107,500 $2,659,000 $551,500 26.2% Five Dock Inner West $2,235,000 $2,800,000 $565,000 25.3% The latest data shows a broad mix of locations that have outperformed, from regional NSW hubs and lifestyle destinations to Sydney suburban hotspots.
Homes in Farley in the Hunter Valley topped the list with growth of more than $200,000, representing a +43 per cent surge in just six months.
Gordon saw the median sale price explode by over $1 million, Sans Souci in Sydney's south got a +40 per cent boost, and desirable locations in the Inner West like Russell Lea and Five Dock also greatly surpassed the city's baseline performance.
Note: The above data is sourced from CoreLogic from February 2023 to January 2024.
 - https://sketch.com --%3e %3ctitle%3eicons / icon-chevron-down%3c/title%3e %3cdesc%3eCreated with Sketch.%3c/desc%3e %3cg id='icons-/-icon-chevron-down' stroke='none' stroke-width='1' fill='none' fill-rule='evenodd'%3e %3crect id='Icon-container' x='0' y='0' width='24' height='24'%3e%3c/rect%3e %3cpolygon id='Shape' fill='%2300AB55' points='12 14.3357864 5.20710678 7.54289322 3.79289322 8.95710678 12 17.1642136 20.2071068 8.95710678 18.7928932 7.54289322'%3e%3c/polygon%3e %3c/g%3e%3c/svg%3e)
Melbourne and Victoria
The Melbourne market has faced more of an uphill battle than most capitals over the past year, but that hasn't stopped well over 15 suburbs breaking through more than $100,000 growth in just the last six months.
Melbourne and VIC suburbs with $100k-plus growth in six months
Suburb Area Median price Feb23-Jul23 Median price Aug23-Jan24 Median price change Growth Heathcote Greater Bendigo Region $411,000 $550,000 $139,000 33.8% Bunyip Gippsland $680,000 $905,000 $225,000 33.1% Ringwood North East $1,050,000 $1,325,000 $275,000 26.2% Baranduda North Eastern $487,000 $610,750 $123,750 25.4% Kingsville West $1,082,500 $1,350,000 $267,500 24.7% Elliminyt Otway Ranges $605,000 $750,000 $145,000 24.0% South Melbourne Inner City $1,317,500 $1,630,000 $312,500 23.7% Toorak East $3,586,500 $4,400,000 $813,500 22.7% Keilor North $990,000 $1,211,000 $221,000 22.3% Box Hill East $1,388,000 $1,680,000 $292,000 21.0% Upwey Yarra-Dandenong Ranges $832,000 $985,000 $153,000 18.4% Caulfield East $1,700,000 $2,000,000 $300,000 17.7% Watsonia North $815,500 $950,000 $134,500 16.5% Beaconsfield South East $920,000 $1,069,000 $149,000 16.2% Warranwood East $1,145,000 $1,325,000 $180,000 15.7% Percentage-wise, regional spots Heathcote and Bunyip were the biggest movers from August to January, with both surging more than +33 per cent compared to the previous six months.
Melbourne suburbs like Ringwood North, Kingsville and South Melbourne all saw median prices shoot up in excess of $250,000, while affluent Toorak comfortably cleared a staggering $800,000.
Other top performers included Elliminyt in the state's southwest, Keilor in Melbourne's northwest, and Box Hill which gained just over $290,000.
Note: The above data is sourced from CoreLogic from February 2023 to January 2024.
Brisbane and Queensland
Queensland, particularly its capital and southeast region, has been a runaway success for several years now, with Brisbane property posting gains of more than +15 per cent over the past year.
It may come as no surprise, then, that dozens of suburbs in the Sunshine State saw price growth of well over $100,000 in the past six months alone.
Brisbane and QLD suburbs with $100k-plus growth in six months
Suburb Area Median price Feb23-Jul23 Median price Aug23-Jan24 Median price change Growth Manly Bayside $1,130,000 $1,565,000 $435,000 38.5% Clayfield City & North $1,370,000 $1,877,500 $507,500 37.0% Kangaroo Point Inner South $1,200,000 $1,640,975 $440,975 36.8% Alice River Townsville & District $550,000 $749,000 $199,000 36.2% Ascot City & North $2,150,000 $2,925,000 $775,000 36.1% Banya Sunshine Coast $553,750 $750,000 $196,250 35.4% Macgregor Southside $968,000 $1,310,000 $342,000 35.3% Parkhurst Gladstone Rockhampton & Capricornia $522,500 $690,000 $167,500 32.1% Mount Coolum Sunshine Coast $1,025,000 $1,350,000 $325,000 31.7% Basin Pocket Ipswich & West Moreton $432,500 $566,500 $134,000 31.0% Surfers Paradise Gold Coast $1,280,000 $1,670,000 $390,000 30.5% North Ward Townsville & District $453,000 $590,000 $137,000 30.2% Chelmer City & North $1,522,500 $1,967,500 $445,000 29.2% Woodford Redcliffe / Bribie / Caboolture $667,500 $855,000 $187,500 28.1% Coopers Plains Southside $770,000 $985,000 $215,000 27.9% The top earner for the period was the waterfront Manly in Brisbane's east with growth of more than +38 per cent, adding $435,000 to the median home value.
Other city-adjacent spots like Clayfield, Kangaroo Point and Ascot delivered gains in excess of +35 per cent, while Sunshine Coast and Gold Coast suburbs like Banya, Mount Coolum and Surfers Paradise also posted very substantial growth.
The explosive upturn wasn't only limited to the state's southeast, though, with Alice River and North Ward among the locations further north that also cracked the top 15 movers.
Note: The above data is sourced from CoreLogic from February 2023 to January 2024.
Adelaide and South Australia
Like Queensland, South Australia has seen incredible levels of prosperity in property since the pandemic began.
Adelaide home values are up nearly +12 per cent on an annual basis and have continued to rise rapidly every month.
Adelaide and SA suburbs with $100k-plus growth in six months
Suburb Area Median price Feb23-Jul23 Median price Aug23-Jan24 Median price change Growth Davoren Park North & North East Suburbs $275,000 $396,000 $121,000 44.0% Elizabeth South North & North East Suburbs $300,000 $418,750 $118,750 39.6% Lyndoch Barossa Valley $485,000 $665,000 $180,000 37.1% Woodville South Western & Beachside Suburbs $690,000 $918,750 $228,750 33.2% Para Hills West North & North East Suburbs $460,000 $600,000 $140,000 30.4% Littlehampton Adelaide Hills $600,000 $780,000 $180,000 30.0% Tranmere Eastern Suburbs $910,750 $1,178,000 $267,250 29.3% Osborne Western & Beachside Suburbs $539,500 $691,000 $151,500 28.1% Moana Fleurieu Peninsula $650,500 $822,000 $171,500 26.4% Marden Eastern Suburbs $750,000 $947,500 $197,500 26.3% Nuriootpa Barossa Valley $437,125 $550,000 $112,875 25.8% St Clair Western & Beachside Suburbs $459,000 $575,000 $116,000 25.3% Prospect North & North East Suburbs $900,000 $1,125,000 $225,000 25.0% Kilburn Western & Beachside Suburbs $575,000 $710,000 $135,000 23.5% West Beach Western & Beachside Suburbs $1,075,000 $1,320,000 $245,000 22.8% While South Australia represents relative affordability compared to other states, there was no shortage of suburbs that exceeded $100,000 growth in the past six months, with Davoren Park in Adelaide's north delivering the top performance with gains of +44 per cent.
Neighbouring locations like Elizabeth South, Para Hills West and Prospect also over-delivered with growth in excess of +25 per cent over the period. Western suburbs like Woodville South, Osborne and St Clair also featured heavily in the top 15 rankings.
Beyond the capital city, suburbs like Lyndoch and Nuriootpa in the Barossa Valley also saw prices rise comfortably above the $100,000 mark.
Note: The above data is sourced from CoreLogic from February 2023 to January 2024.
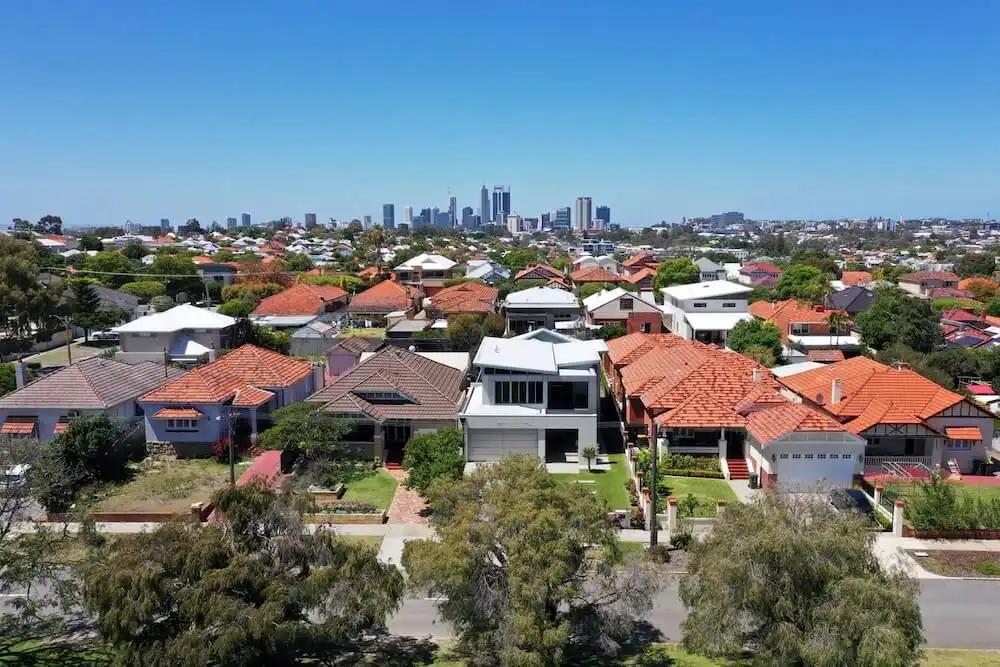
Perth and Western Australia
Where Queensland and South Australia have been in overdrive for the past year, Western Australia has taken a significant leap further to deliver the strongest growth of any state by far.
Perth property prices have soared more than +18 per cent in the last 12 months, with plenty of suburbs going far in excess of that figure in the six months to January 2024.
Perth and WA suburbs with $100k-plus growth in six months
Suburb Area Median price Feb23-Jul23 Median price Aug23-Jan24 Median price change Growth Ravenswood South $380,000 $540,000 $160,000 42.1% Darlington Perth Hills $850,500 $1,170,000 $319,500 37.6% Dongara North $415,000 $550,000 $135,000 32.5% Perth Perth City $495,000 $655,000 $160,000 32.3% South Guildford Eastern Suburbs $510,000 $673,944 $163,944 32.2% Mosman Park Western Suburbs $1,737,500 $2,250,000 $512,500 29.5% Mount Helena East $607,500 $780,000 $172,500 28.4% Binningup Bunbury & surrounds $430,000 $550,000 $120,000 27.9% Melville Southern Suburbs $940,000 $1,200,000 $260,000 27.7% Lockridge Eastern Suburbs $407,500 $516,500 $109,000 26.8% Treeby Southern Suburbs $552,250 $696,000 $143,750 26.0% Hillman Southern Suburbs $390,000 $490,000 $100,000 25.6% Manning Southern Suburbs $952,500 $1,190,000 $237,500 24.9% Parkerville Perth Hills $742,500 $919,000 $176,500 23.8% Jandakot Southern Suburbs $760,500 $940,000 $179,500 23.6% Regional WA town Ravenswood was the sole suburb to breach +40 per cent over the six-month period, while back in the capital, Darlington, Dongara and Perth itself all comfortably cleared +30 per cent growth.
Southern suburbs like Treeby, Hillman and Manning all saw prices pumped up by more than $100,000, with homes in Mosman Park clocking the biggest dollar-value gains with over $500,000 added to the median property price.
Note: The above data is sourced from CoreLogic from February 2023 to January 2024.
Thinking of selling in 2024?
On the whole, the past year has delivered some amazing growth for homeowners around Australia despite the high interest rate environment, as evidenced by the numbers above.
It's key to consider, however, that if the median sale price in your suburb has jumped by +20 per cent, that doesn't necessarily mean that your home has grown +20 per cent in value. It may just reflect that more valuable homes have been sold in your market recently.
Getting a more accurate understanding of how properties like yours are performing in your area will require some research. Look at how similar sold homes have performed in your area to get a better sense of where your property sits in the market.
Making use of a free online estimation tool, getting a free property report, or speaking to a top local agent to get an appraisal are great ways to get a more tailored view of how your home should be valued in current local conditions.