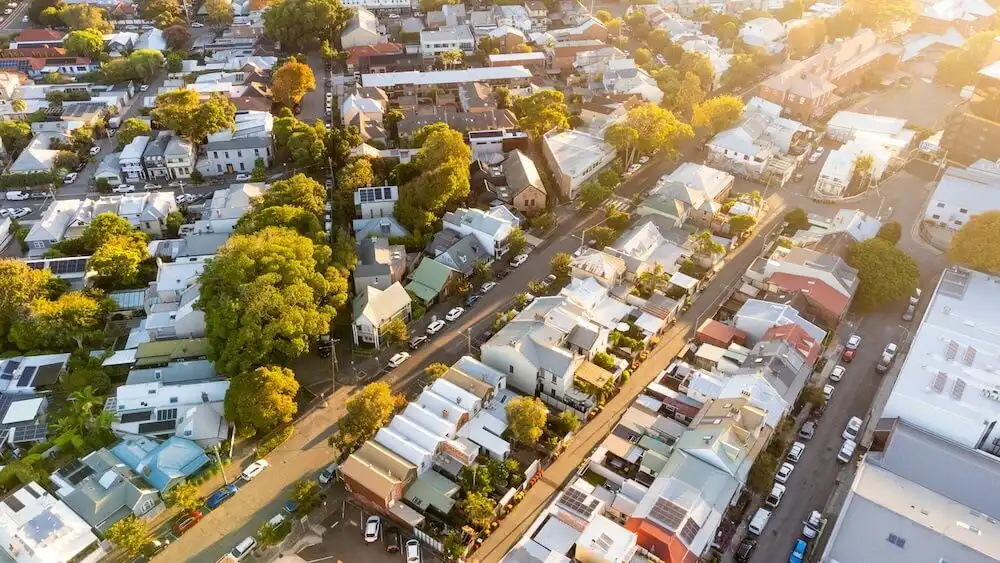
Property growth eases nationwide as conditions continue to diverge

Australia's property market grew at its slowest pace in fifteen months in April, as rising interest rates and weakening consumer confidence continued to weigh on buyer activity.
The headline figure, however, masks a more varied picture. While Sydney and Melbourne are now in a clear downward trend, most other markets are still recording genuinely solid growth.
With the gap between Australia's strongest and softest markets continuing to widen, the national number tells sellers less than it ever has.

Get a free property value estimate
Find out how much your property is worth in today’s market.
Australian property prices: April 2026
The national median home value rose by +0.3 per cent over April to reach $940,048, according to Cotality's latest report, taking annual gains to +9.8 per cent.
| Market | Month | Quarter | Annual | Median value |
|---|---|---|---|---|
| Sydney | -0.6% | -0.9% | 4.2% | $1,292,157 |
| Melbourne | -0.6% | -1.5% | 2.0% | $822,969 |
| Brisbane | 1.2% | 4.7% | 19.7% | $1,116,180 |
| Adelaide | 1.1% | 3.5% | 12.2% | $944,673 |
| Perth | 2.1% | 6.8% | 26.0% | $1,039,949 |
| Hobart | 0.2% | 2.6% | 8.5% | $744,296 |
| Darwin | 1.3% | 3.0% | 19.6% | $619,351 |
| Canberra | 0.0% | 0.4% | 5.6% | $898,242 |
| Combined capitals | 0.2% | 1.1% | 9.1% | $1,031,838 |
| Combined regional | 0.9% | 3.1% | 12.0% | $765,769 |
| Australia | 0.3% | 1.6% | 9.8% | $940,048 |
Sydney and Melbourne both fell -0.6 per cent over the month, extending a decline that has been running since November last year. Sydney is now -1.0 per cent below its November peak, while Melbourne has retreated -1.9 per cent from its most recent high.
Perth continued to lead the country, adding +2.1 per cent for the month and +6.8 per cent over the quarter, with the city's median sitting comfortably above the million-dollar mark. Brisbane gained +1.2 per cent and Adelaide +1.1 per cent, while Darwin added +1.3 per cent.
Hobart slowed sharply to just +0.2 per cent, and Canberra was flat for the month. Regional markets held up better than the combined capitals, rising +0.9 per cent over the month and +3.1 per cent over the quarter, with no regional sub-market recording a decline over the first four months of the year.
Cotality's research director, Tim Lawless, said the easing in conditions has been building for some time.
"The housing market was losing momentum from late last year as affordability and serviceability constraints weighed on demand. Now we have the additional downside pressure of higher interest rates, sentiment has fallen off a cliff, and rising inflation is set to drive the cost of debt even higher."
Three key takeaways from the current market
April's data reflects a market that is clearly losing pace, though conditions remain highly varied depending on where you look. Here are the three trends worth understanding.
The slowdown has deeper roots than the recent rate hikes
It would be easy to pin April's soft national result on February and March's interest rate hikes alone, but Cotality's data points to a more complicated picture.
The slowdown was already underway before rates rose, and well before the conflict in Iran began pushing energy prices higher. Affordability had been eroding for months, wage growth was already failing to keep pace with inflation, and borrowing capacity had been quietly tightening throughout late 2025.
Cotality's report noted that housing affordability "is at record lows across most capitals" — a trend that was firmly in place before the recent rate decisions added further pressure.
The rate hikes and geopolitical uncertainty have accelerated the shift, but they didn't cause it. The market was already moving in this direction, which means the current slowdown is less of a sudden shock and more of a gradual adjustment that has been building for several months.
Advertised supply is rising in some cities and still critically low in others
One of the clearest explanations for why markets are performing so differently right now is what's happening with the volume of homes for sale.
In Sydney, advertised stock has now crossed above the five-year average, sitting 9.4 per cent higher than typical levels for this time of year. Melbourne is heading the same way. More choice for buyers means less urgency, longer selling times, and growing downward pressure on prices.

Auction clearance rates have been holding below 55 per cent since the last week of March, another sign that conditions in the softer markets are tilting more firmly toward buyers.
The picture looks completely different elsewhere. Perth's advertised stock remains around 40 per cent below the five-year average, which continues to underpin strong price growth despite the broader headwinds. Brisbane and Adelaide are in a similar position, with listings still well below typical levels keeping a firm floor under values.
Regional markets are also benefiting from tight supply, supported by relatively lower prices and solid internal migration, with values rising across every state regional market over the first four months of the year.
Upper and lower quartile markets are moving in very different directions
Beneath the city-level data, one of the most telling trends in April's report is the widening gap between the most and least expensive parts of the market.
Every single capital city is now recording stronger growth in its lower quartile — meaning homes priced in the bottom 25 per cent of that market — than in its upper quartile, as demand concentrates where credit is most accessible.
The contrast is sharpest in Sydney. Mr Lawless noted that "lower-tier house values are up 2.9% year-to-date compared with a 3.3% fall across the most expensive quarter of the market" — a spread of more than six percentage points within the same city.
A key driver of lower-end demand is the federal government's 5 per cent deposit guarantee scheme, which continues to bring first home buyers into the market at more affordable price points, adding to competition in a segment already seeing strong interest from investors.
It is a reminder that the headline figures for any given city represent an average across a highly varied market. Conditions at a suburb and price-point level can differ considerably from what the top-line data suggests.

What's next for Australian property?
The big question for the market is still interest rates. Cotality's report points to financial markets pricing in at least two more rate hikes in 2026, with oil prices running well above pre-war levels keeping upward pressure on inflation.
Further rate rises would push household budgets harder and make it more difficult for buyers to borrow. Consumer confidence has dropped sharply through April, and spending on big financial commitments like property tends to track sentiment fairly closely.
The supply picture is still doing a lot of the work in keeping values from falling across most of the country.
Construction costs are high and likely to climb further as fuel and material prices rise, meaning a meaningful jump in new housing supply is unlikely in the near term. In most markets outside Sydney and Melbourne, that ongoing shortage should limit the risk of significant price falls.
The jobs market is also holding firm, which reduces the chance of a wave of forced selling even as household budgets come under more pressure.
Cotality's view is that what lies ahead is a gradual loss of pace rather than any kind of sharp correction, with results likely to stay varied by location and price point as 2026 progresses.
For sellers, the fundamentals that have driven the market this far haven't disappeared — but how the rate and inflation story unfolds over the coming months will go a long way to shaping the rest of the year.