Australian property market update - May 2019

Although national house prices are still trending lower across most states in May 2019, there are signs that the downturn is easing, with the slower rate of decline the main indicator analysts are highlighting.
If you read our March 2019 market update the rate of decline actually eased in March relative to the past four months. This trend has continued through to May, which could signal the end of the downturn - though it remains to be seen what the impact of the June interest rate cut and the Federal election result will have on the broader market.
Overall the national property market is still softening, with values slipping and the pace of growth sluggish in most, though not all, markets.
Let's first take a look at the big picture and then move onto each state to see where the best and weakest performing markets are currently.

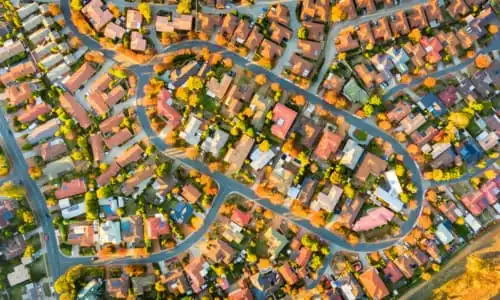
National property values: May 2019 quarter

National dwelling values were down 0.4 per cent in May, which was the smallest month-on-month fall since May 2018.
Values also dropped -1.5 per cent for the quarter and prices are down -7.3 per cent over the year. If you look at the combined capitals these are down -0.2 per cent for May '19, -1.7 per cent for the quarter and -8.4 per cent for the year to May. Overall regional markets have continued to outperform urban areas, and are up +1.8 per cent over the year to date.
The standout capital city in terms of performance is Canberra, which is up +0.2 per cent for the quarter, while Darwin takes home the wooden spoon with a fall of -3.3 per cent over the same timeframe. Hobart is still the long distance champion, posting returns of +3.4 per cent over the year to date, even though it was down -0.7 per cent over the quarter and has tracked lower for the last two months.

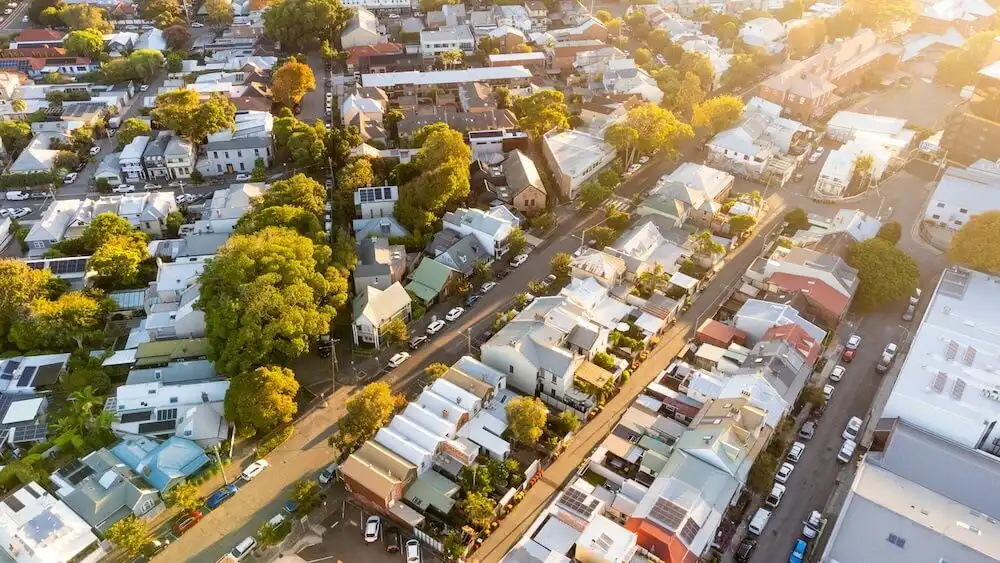
Market update: Sydney and regional NSW
Sydney properties continued its slide in May, down -0.5 per cent, while the market is also down -2.0 per cent over the quarter and -10.7 per cent over the year to date. This is the smallest monthly decline in dwelling values since March 2018, and one sign the Sydney market could be on the road to recovery.
Clearance rates are also looking healthier with CoreLogic reporting that Sydney's rose to 66.1 per cent, up from 47.1 per cent last year.
Despite this, parts of Sydney - including the Eastern suburbs (-10.7 per cent) and the Inner West (-15.0 per cent) - have recorded some of the biggest falls over the past year. So if you are looking to buy in Sydney, the median price of a house is currently a slightly more affordable $869,579, while the median price for a unit is currently in the region of $678k.
If you are looking at regional NSW, many areas are now in retreat, with the Illawarra (-10.8 per cent) and Newcastle area (-9.2 per cent) leading the downturn. Areas that have bucked this trend include the Riverina, up an impressive +6.8 per cent over a year.

Market update: Melbourne and Victoria
Melbourne continues to mirror the falls in Sydney, albeit at a lower rate, falling -0.3 per cent in May to a -1.7 per cent drop for the quarter, and a fall of -9.9 per cent for the year to date. This is also the smallest monthly decline in Melbourne dwelling values since March 2018.
Clearance rates are also improving in Melbourne, up 64 per cent from a rate of 59.8 per cent last year. According to CoreLogic, the median house price in Melbourne is currently $708,523 with units at $528,406.
"Clearance rates are improving in Melbourne, up 64 per cent from a rate of 59.8 per cent last year"
Regional areas that have performed well in Victoria include Shepparton (+4.7 per cent) and Ballarat (+4.4 per cent), while the Inner South (-12.6 per cent) and Inner East (-14.1 per cent) are among the poorest performing areas in the capital. Gross rental yields in Melbourne are currently +3.7 per cent, 0.7 per cent up in 2018.
Market update: Hobart and regional Tasmania

Property prices in Hobart have come under pressure over the last few months, falling -0.4 per cent in May, and -0.7 per cent over the quarter. However, they are still +3.4 per cent up over the year.
Regional Tassie markets are still performing well, with the West, North West and South East of the state leading this sector nationally, with growth of +7.6 per cent in the year to date.
Median prices in Hobart are currently in the region of $478,247 for houses and $363,418 for units - making it an attractive market based on price alone. In terms of rental yields, Hobart has the fastest rising rents of all the state capitals, up +4.9 per cent over the year, so the rental market is still strong there.
Market update: Brisbane and regional Queensland
Brisbane's market has displayed a similar trend to Sydney and Melbourne, down -0.5 per cent in May, a drop of -1.4 per cent over the quarter. This all adds up to an annual decline of -2.3 per cent for the Sunshine State capital. Median values for houses in Brisbane are currently $531,047, with units at $375,475.
Gross rental yields for Brissie are 4.6 per cent, up 0.2 per cent on last year.
In terms of individual performance, Brisbane's western suburbs have struggled, down -0.2 per cent over the year, while regional markets like the state's Outback have borne the brunt of falls, dropping an eye-watering -30.7 per cent over the last year.
Unlike Sydney and Melbourne clearance rates have not improved in Brissie - currently at 35.7 per cent and down from 43.9 per cent in 2018.
Market update: Canberra and the ACT
Canberra was the top performing capital in May this year, rising 0.2 per cent over the quarter, though prices did dip -0.2 per cent overall in May.
Overall the market here is up +3.5 per cent year to date, with gross rental yields also up 0.3 per cent annually to 4.9 per cent this year. This reflects the generally high demand for property in the nation's capital. The median house price in Canberra is currently $658,407, with units at $435,392.
"Canberra was the top performing capital in May this year, where the market is up +3.5 per cent over the year to date"
Market update: Adelaide and South Australia
Adelaide still has one of the lowest median house ($465,625) and unit ($326,831) prices of all state capitals, with only Darwin cheaper. This is perhaps why property prices rose +0.2 per cent in May - to take it to a positive +0.4 per cent growth for the year to date.
Suburbs in the north of the city rose +0.7 per cent, with Adelaide's southern suburbs also up (+0.6 per cent) over the last year. Rental yields remain steady at +4.4 per cent in Adelaide.
Regional SA is a mixed picture however, with rural properties in Outback areas down -10.3 per cent overall for the year to date.
Market update: Perth and regional WA
Perth and much of regional WA continue to struggle, with the state capital dropping -1.0 per cent in May alone. This left it at a negative -1.8 per cent for the quarter and down -8.8 per cent for the year to date. The median house price in Perth is currently $459,823, while units are at $355,048.
It's a similar picture for many regional areas of the state, with Outback areas down -17.7 per cent and the Wheat Belt down -14.9 per cent. Rental yields are still healthy for Perth at 4.3 per cent, up 0.4 per cent over last year.
What does all this mean?
Most analysts are predicting that the downturn will bottom out during the remainder of 2019, so there are more falls still to come with the view that the market will recover in 2020.
Despite these predictions, we should bear in mind that each postcode is effectively it's own market, and performance can also vary widely within a suburb, city and state. We also don't know the long term impact of interest rate cuts on the property market - with more potentially in the pipeline - and what broader global economic uncertainty means for house prices.
"Despite these predictions, we should bear in mind that each postcode is effectively it's own market, and performance can also vary widely within a suburb, city and state."
Only time will tell what the next quarter brings!
If you are thinking of selling, make sure you do it right. A good place to start is our Smart Seller's Guide which can help you sell better, smarter and faster. We can also help you work out how much your home is worth in today's market, which includes a free property report.