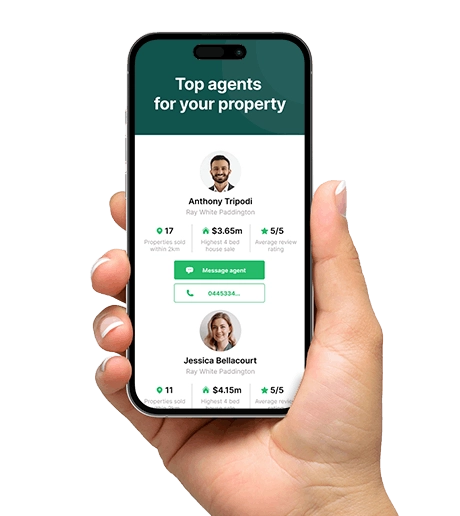
Sydney property market news - key takeaways
- Prices easing across Sydney: The Sydney property market recorded a -0.6 per cent monthly fall in April 2026, with dwelling values now sitting around 1.0 per cent below their November 2025 peak.
- Supply shifting toward buyers: New listings dropped -10.4 per cent year on year, yet total stock is still falling more slowly as homes sit on market longer, giving buyers more choice than has been typical in recent years.
- Auctions favour buyers: Sydney's latest auction clearance rate of 51.0 per cent means roughly half of all properties taken to auction are not selling on the day, a result well below the long-run average that hands negotiating power to buyers.
- Rents still climbing: Sydney rents rose +5.9 per cent annually and the vacancy rate tightened to 1.1 per cent, keeping conditions firmly in landlords' favour despite yields sitting at the lowest of any capital city.
- Rate rises adding pressure: With the RBA cash rate at 4.10 per cent and most economists expecting further increases in 2026, borrowing capacity for Sydney buyers is being squeezed at a time when the median dwelling already sits at $1,292,157.

Get a free property value estimate
Find out how much your property is worth in today’s market.
Sydney property price movements
Sydney's property market has been losing ground through early 2026, with both houses and units recording falls over the most recent month and quarter. Annual gains remain positive, but the gap between where prices were at the end of last year and where they sit now has been widening.
Sydney property prices - May 2026
Sydney homes slipped -0.6 per cent in April 2026, extending a quarterly decline of -0.9 per cent. Annual growth of +4.2 per cent means values are still comfortably above where they were a year ago, though the direction of travel in recent months is clearly downward.
| Property type | Current median price | Monthly change | Quarterly change | Annual change |
|---|---|---|---|---|
| All Sydney dwellings | $1,292,157 | -0.6% | -0.9% | +4.2% |
Source: Cotality
The April median of $1,292,157 represents a fall of around $7,800 from the prior month's implied median of roughly $1,299,957. Sydney is now sitting approximately 1.0 per cent below its November 2025 peak, a decline that has built steadily across each of the past several months.
House prices in Sydney
Sydney house prices fell -0.7 per cent in April 2026, a slightly steeper monthly drop than the broader market. The quarterly picture is weaker still, with Sydney housing market values down -1.4 per cent over the past three months while still holding a +4.4 per cent annual gain.
| Property type | Current median price | Monthly change | Quarterly change | Annual change |
|---|---|---|---|---|
| Sydney houses | $1,600,301 | -0.7% | -1.4% | +4.4% |
Source: Cotality
The April median of $1,600,301 is around $11,300 below the prior month's implied figure of approximately $1,611,601. A widening gap between price tiers tells much of the story at this level: Tim Lawless, Research Director at Cotality, said in the Cotality Home Value Index, "The largest difference between upper and lower quartile value growth is in Sydney, where lower-tier house values are up 2.9 per cent year-to-date compared with a 3.3 per cent fall across the most expensive quarter of the market."
Unit prices in Sydney
Sydney unit prices eased -0.4 per cent in April 2026, a smaller monthly fall than houses recorded. Sydney unit prices are holding a slim quarterly gain of +0.3 per cent, suggesting units have been somewhat more resilient to the recent softening than detached houses.
| Property type | Current median price | Monthly change | Quarterly change | Annual change |
|---|---|---|---|---|
| Sydney units | $907,431 | -0.4% | +0.3% | +3.4% |
Source: Cotality
The April median of $907,431 is around $3,600 below the prior month's implied figure of approximately $911,031. Annual growth of +3.4 per cent for units trails the +4.4 per cent recorded for houses over the same period, though the quarterly comparison runs the other way, with units holding positive ground while houses have given back -1.4 per cent.
Sydney property market forecasts 2026
Australia's Big 4 banks publish annual house price forecasts as part of their economic research divisions, and their views on Sydney for 2026 differ noticeably. The spread across CBA, Westpac, NAB and ANZ is wider than usual this year, reflecting genuine disagreement about how rising rates and softening demand will play out across the rest of the calendar year.
- CBA: CBA predicts Sydney property prices to rise +2.0 per cent over 2026.
- Westpac: Westpac predicts Sydney property prices to rise +3.0 per cent over 2026.
- NAB: NAB's published forecast is at the New South Wales state level; it predicts dwelling prices to rise +2.4 per cent over the next 12 months across New South Wales.
- ANZ: ANZ predicts Sydney property prices to fall -0.7 per cent over 2026.
The Sydney house price forecast range runs from -0.7 per cent (ANZ) to +3.0 per cent (Westpac), a spread of 3.7 percentage points. ANZ is the clear outlier, the only bank calling an outright decline, while the remaining three cluster between +2.0 and +3.0 per cent. That clustering suggests most banks expect the current softness to stabilise rather than deepen, though ANZ's Sydney house price trend view reflects greater concern about the compounding effect of two consecutive rate rises on a market already stretched on affordability.
Consultancy KPMG sits considerably more bullish than the Big 4, forecasting +5.5 per cent dwelling growth across 2026 (houses +5.8 per cent, units +5.3 per cent).
RBA cash rate forecast 2026
At its March 2026 meeting, the RBA lifted the cash rate to 4.10 per cent, up from 3.60 per cent at the previous setting. The decision reflected persistent inflationary pressures, a tight labour market, and elevated energy prices linked to the Middle East conflict, all of which have added to the upside risk on inflation. Financial market pricing and the majority of market economists point to further rate increases ahead in 2026.
- CBA: CBA's latest commentary points to ongoing upward pressure on the cash rate, with further rises expected in 2026 given the current inflationary environment.
- Westpac: Similar to CBA, Westpac anticipates additional rate increases in 2026, with the pace and timing dependent on how inflation and the labour market evolve over coming months.
- NAB: NAB has not published a revised cash rate forecast since the March RBA decision, but its recent commentary points in the same direction as broader market expectations of at least one further increase in 2026.
- ANZ: ANZ has not published a revised cash rate forecast since the latest RBA decision, but its view that Sydney prices will fall in 2026 implies an expectation that rates will remain at elevated levels long enough to weigh materially on demand.
What this means for the Sydney market
A cash rate of 4.10 per cent translates directly into reduced borrowing capacity for Sydney buyers, a market where the median dwelling already sits at $1,292,157. Even a modest reduction in what a household can borrow has an outsized effect in Sydney compared with other capitals, simply because the entry price is higher.
For first-home buyers and those upgrading from units to houses, the squeeze is most acute. The gap between what buyers can borrow and what properties cost at the upper end of the market is widening, which helps explain why lower-priced segments are holding up better than prestige properties right now. Units, with a median of $907,431, are proving more resilient than houses on a quarterly basis, a pattern that typically strengthens as rate cycles peak.
Several of the Big 4 forecasts were finalised before the March rate rise took effect in the broader economy, so the full impact on buyer sentiment and borrowing capacity may not yet be priced into those numbers. Bank views are likely to be revised as mid-year data comes through and the RBA's next moves become clearer.
Sydney house prices graphs and charts
Sydney house price growth over the last 5 years has moved from a sharp COVID-era boom into a steadier upswing and, more recently, a gentle recovery. As of February 2026, dwelling values rose by +0.2 per cent in the month, +0.2 per cent over the quarter and +6.4 per cent over the past 12 months, leaving values -0.1 per cent below the November 2025 record, as per Cotality’s latest figures.

The five-year chart shows Sydney’s 2021 boom gave way to a meaningful but relatively short downturn in 2022, with the market recovering through 2023 into a “grind higher” pattern rather than another rapid surge. Cotality’s analysis highlights that low advertised stock has helped limit the depth of falls and kept price gains subdued but consistent across 2023–2025.
Sydney property 30 year property price graph

Sydney property prices growth over the last 10 years has been strong overall: a large upswing into 2021 was followed by a correction in 2022 and a steady rebuild of momentum through 2023–2025, demonstrating long-run demand, tight supply and the outsized role of interest-rate moves in recent cycles.
Over the past three decades Sydney has recorded some of the biggest cumulative gains in Australia, but the path has been boom–bust–recovery cycles driven by changes in credit, investor activity and population growth; today homeowners feel more cautious than in 2021 while many buyers are still watching rates and affordability, balancing a desire to buy with a need for certainty about repayments and timing.
Sydney selling statistics
Selling conditions in Sydney are softening. Fewer new listings are coming to market, yet total stock is still edging down year on year, and the time it takes to sell a property has barely shifted from a year ago. Buyers are gaining a little more negotiating room, but sellers are not yet conceding much ground.
Sydney sales volume and days on market
Sydney sales volumes rose just +0.6 per cent year on year, a notably weaker result than the +2.9 per cent recorded across the combined capitals and the +4.7 per cent nationally. Properties are taking 33 days to sell on average, one day faster than the 34 days recorded a year ago.
| Sydney sales volume | Sydney days on market |
|---|---|
| 0.6% Change from 12mo ago | 33 days 34 days 12 mo ago |
Source: Cotality
Sydney's 33-day selling time sits well above both the combined capitals average of 27 days and the national average of 30 days. That gap suggests Sydney properties are taking meaningfully longer to find a buyer than in most other markets, which gives buyers more time to assess their options and reduces the pressure to act quickly.
Sydney new and total listings
New listings fell -10.4 per cent year on year, a steep drop that points to many owners choosing to hold rather than sell in the current climate. Total listings were down -3.1 per cent over the same period, a more modest decline that reflects homes taking longer to clear rather than a genuine contraction in overall stock.
| Sydney new listings | Sydney total listings |
|---|---|
| -10.4% Change from 12mo ago | -3.1% Change from 12mo ago |
Source: Cotality
The gap between a sharp fall in new listings and a more modest fall in total listings tells an important story. Fewer sellers are entering the market, but the homes that are listed are sitting for longer, keeping total stock from falling as sharply as new supply would suggest. Advertised stock in Sydney is running above its five-year average, meaning buyers currently have more choice than has been typical in recent years, which is part of the reason price growth has softened.
Sydney vendor discount and auction clearance rates
Vendor discounting is the percentage difference between the initial asking price and the final sale price, and auction clearance rates show the share of scheduled auctions that sell under the hammer or immediately after. Together, these measures tell us how much room buyers have to negotiate and how confident buyers are when competing for property.
Sydney vendor discount
| Mar 2026 | Mar 2025 | |
|---|---|---|
| Sydney median vendor discount | -3.0% | -3.4% |
Source: Cotality
Vendors are currently discounting by -3.0 per cent on average, a slight improvement from -3.4 per cent a year ago. That means sellers are conceding a little less ground than they were twelve months back, though a discount of this size still represents a meaningful gap between what sellers initially ask and what buyers are prepared to pay.
Sydney auction clearance rates
| Sydney | 26 Apr 2026 |
|---|---|
| Total Auctions | 251 |
| Sold | 128 |
| Withdrawn | 49 |
| Passed in | 74 |
| Clearance Rate | 51.0% |
Source: Cotality
The most recent weekly clearance rate of 51.0 per cent sits firmly in buyer-favourable territory. At that level, roughly half of all properties taken to auction are passing in or being withdrawn, a result that Tim Lawless, Research Director at Cotality, said in the Cotality Home Value Index "coincides with falling auction clearance rates and a pickup in advertised supply, providing buyers with more choice and less urgency at the negotiation table."
A rate this far below the long-run average of around 64 per cent signals that sellers are under real pressure, and buyers who are active in the market are in a notably stronger negotiating position than they have been for some time.
Get a deeper insight into how Sydney sellers are faring in 2026 and what could be on the horizon for the the year ahead with some of our latest articles.
Sydney property investing
Sydney's rental market remains under significant pressure, with tight supply and strong population growth continuing to push rents higher across both houses and units. For investors, the city offers steady rental income growth but yields that reflect just how expensive Sydney property has become relative to the returns it generates.
Sydney rental market
The table below sets out annual rent growth and gross rental yields for Sydney, other capital cities and broader national benchmarks, with a house and unit breakdown where data is available.
| Location | Rental rates | Rental yield | Annual change in rents, houses | Annual change in rents, units |
|---|---|---|---|---|
| National | 5.7% | 3.6% | NA | NA |
| Combined Capitals | 5.6% | 3.4% | NA | NA |
| Combined Regional | 6.0% | 4.2% | NA | NA |
| Sydney | 5.9% | 3.1% | 6.0% | 5.5% |
| Melbourne | 4.4% | 3.7% | 4.3% | 4.9% |
| Brisbane | 6.7% | 3.3% | 6.5% | 6.4% |
| Adelaide | 3.6% | 3.4% | 3.2% | 3.7% |
| Perth | 6.7% | 3.7% | 7.0% | 7.4% |
| Hobart | 6.4% | 4.3% | 7.0% | 5.5% |
| Darwin | 9.2% | 6.0% | 8.8% | 9.8% |
| Canberra | 2.6% | 4.0% | 3.3% | 2.0% |
Source: Cotality
Sydney rents rose +5.9 per cent annually, with houses (+6.0 per cent) outpacing units (+5.5 per cent). Despite solid rent growth, Sydney's gross yield of 3.1 per cent sits at the bottom of every capital city in the table, a direct reflection of how high property values have run relative to the income they produce. With the cash rate currently at 4.1 per cent, gross yields of this level sit well below the cost of debt, which means most investors without a large equity position are likely carrying a cash-flow shortfall each month.
Sydney vacancy rates
The vacancy rate is a measure of how many rental properties are sitting empty at any given time. A rate below 2 per cent is generally considered a landlord's market, and SQM Research data shows Sydney's vacancy rate has tightened from 1.3 per cent a year ago to 1.1 per cent in April 2026.
| Location | Mar 2026 vacancy rates | Mar 2026 vacancies | Mar 2025 vacancy rates | Mar 2025 vacancies |
|---|---|---|---|---|
| National | 1.0% | 31,732 | 1.1% | 34,428 |
| Sydney | 1.1% | 8,469 | 1.3% | 9,412 |
| Melbourne | 1.4% | 7,549 | 1.5% | 8,194 |
| Brisbane | 0.8% | 2,662 | 0.9% | 3,207 |
| Adelaide | 0.7% | 1,071 | 0.6% | 988 |
| Perth | 0.5% | 988 | 0.6% | 1,091 |
| Hobart | 0.4% | 121 | 0.5% | 148 |
| Darwin | 0.4% | 93 | 0.8% | 210 |
| Canberra | 1.1% | 700 | 1.5% | 909 |
Source: SQM Research
Sydney's vacancy rate of 1.1 per cent sits just above the national rate of 1.0 per cent, making it marginally looser than the country as a whole, but still well into territory where tenants face a very competitive search. The year-on-year fall from 1.3 per cent to 1.1 per cent, representing 943 fewer vacant properties, shows conditions have tightened further over the past twelve months. Among the capitals, only Melbourne and Canberra have higher vacancy rates than Sydney, and both are also trending down.
Louis Christopher, Managing Director at SQM Research said in the latest SQM rental market report:
"The national vacancy rate dropping to 1.0% highlights just how tight Australia's rental market has become. We are now seeing vacancy rates at critically low levels in several cities, particularly Perth, Darwin and Hobart."
While Sydney is not among the cities Christopher singles out as critically tight, the direction of travel here is the same. Vacancy has been falling steadily, and at 1.1 per cent there is little room for further easing before Sydney joins those more acute markets. For investors, that direction of travel suggests continued upward pressure on achievable rents, even as the gap between yields and borrowing costs remains a genuine challenge
Highest growth areas in Sydney
Despite the broader softening in Sydney's property market, some outer and fringe regions have continued to record strong annual price gains. The table below ranks the top 10 Statistical Area Level 3 (SA3) regions across Greater Sydney by annual percentage growth in April 2026, where each SA3 is an Australian Bureau of Statistics classification that typically groups several adjacent suburbs into a single geographic area.
| Rank | SA3 Name | SA4 Name | Median Value | Annual % Change |
|---|---|---|---|---|
| 1 | Richmond - Windsor | Outer West and Blue Mountains | $1,050,130 | 15.1% |
| 2 | St Marys | Outer West and Blue Mountains | $1,168,327 | 14.3% |
| 3 | Penrith | Outer West and Blue Mountains | $1,113,614 | 13.1% |
| 4 | Blue Mountains | Outer West and Blue Mountains | $1,046,312 | 13.0% |
| 5 | Merrylands - Guildford | Parramatta | $1,330,126 | 12.5% |
| 6 | Campbelltown (NSW) | Outer South West | $1,031,952 | 12.3% |
| 7 | Mount Druitt | Blacktown | $1,014,079 | 12.1% |
| 8 | Wyong | Central Coast | $970,439 | 11.6% |
| 9 | Bringelly - Green Valley | South West | $1,271,308 | 11.5% |
| 10 | Sutherland - Menai - Heathcote | Sutherland | $1,643,260 | 10.9% |
Source: Cotality
Highlights for Sydney’s high growth areas
- Richmond - Windsor: Ranked #1 across Greater Sydney with annual growth of +15.1 per cent and a median value of $1,050,130, Richmond - Windsor is one of Sydney's most affordable entry points within a reasonable distance of the city. Its relative value compared to inner and middle-ring markets continues to attract buyers who have been priced out elsewhere, and the area benefits from infrastructure investment across Sydney's north-west corridor.
- St Marys: Ranked #2 with annual growth of +14.3 per cent and a median value of $1,168,327, St Marys sits in Sydney's outer west and has drawn sustained interest from buyers seeking established housing at a lower price point than many comparable locations closer to the CBD. Ongoing transport improvements in the broader outer-west precinct are adding to the area's appeal.
- Penrith: Ranked #3 with annual growth of +13.1 per cent and a median value of $1,113,614, Penrith has long served as an anchor for the outer-west region and continues to attract younger families and first-home buyers. Its proximity to the future Western Sydney Airport precinct and the amenity of a well-established regional centre support continued demand.
- Outer-west cluster: Ranks #4 through #6, Blue Mountains (+13.0 per cent, $1,046,312), Merrylands - Guildford (+12.5 per cent, $1,330,126) and Campbelltown (NSW) (+12.3 per cent, $1,031,952), span Sydney's outer-west and outer-south-west, where buyers responding to affordability constraints have been pushing demand into suburbs where the median still sits at or just above the $1,000,000 mark. All three recorded growth rates well above the city-wide annual average.
- Western and coastal fringe: Ranks #7 through #9, Mount Druitt (+12.1 per cent, $1,014,079), Wyong (+11.6 per cent, $970,439) and Bringelly - Green Valley (+11.5 per cent, $1,271,308), reflect a broad band of demand stretching from Blacktown through to the Central Coast and the city's south-west growth corridor. Wyong, with a median of $970,439, is the only area in the top ten with a sub-million-dollar median, making it a standout for buyers seeking value on the city's periphery.


