
 - https://sketchapp.com --%3e %3ctitle%3eIcon/search%3c/title%3e %3cdesc%3eCreated with Sketch.%3c/desc%3e %3cg id='Icon/search' stroke='none' stroke-width='1' fill='none' fill-rule='evenodd' stroke-linecap='round' stroke-linejoin='round'%3e %3ccircle id='Oval' stroke='%23252525' cx='10.5145111' cy='10.5145111' r='6.99455261'%3e%3c/circle%3e %3cpath d='M15.4908752%2c15.4908752 L20.5515137%2c20.5515137' id='Line' stroke='%23252525'%3e%3c/path%3e %3c/g%3e%3c/svg%3e)

Canberra property market news - key takeaways
- Annual growth holds firm: The Canberra property market recorded +5.6 per cent annual dwelling value growth to April 2026, with houses leading at +7.0 per cent, even as monthly momentum paused.
- Listings tightening fast: New listings fell -16.0 per cent year on year and total stock is down -7.3 per cent, shrinking buyer choice despite a +9.8 per cent lift in sales volumes.
- Auction market favours buyers: Canberra's auction clearance rate sat at 50.0 per cent for the week ending 26 April 2026, well below the 65-70 per cent threshold that signals a balanced market.
- Rental conditions tightening: Canberra's vacancy rate fell from 1.5 per cent a year ago to 1.1 per cent, while a gross rental yield of 4.0 per cent outperforms most other major capitals.
- Rate rises cloud the outlook: With the RBA cash rate at 4.10 per cent and markets pricing in further increases, borrowing costs are expected to keep a lid on price growth through the rest of 2026.

Get a free property value estimate
Find out how much your property is worth in today’s market.
Canberra property price movements
The Canberra property market held its ground in April 2026, with values broadly flat over the month despite rising interest rate pressures weighing on demand in larger capitals. Annual growth tells a more encouraging story, pointing to a market that has been quietly building momentum through the cycle.
Canberra property prices - May 2026
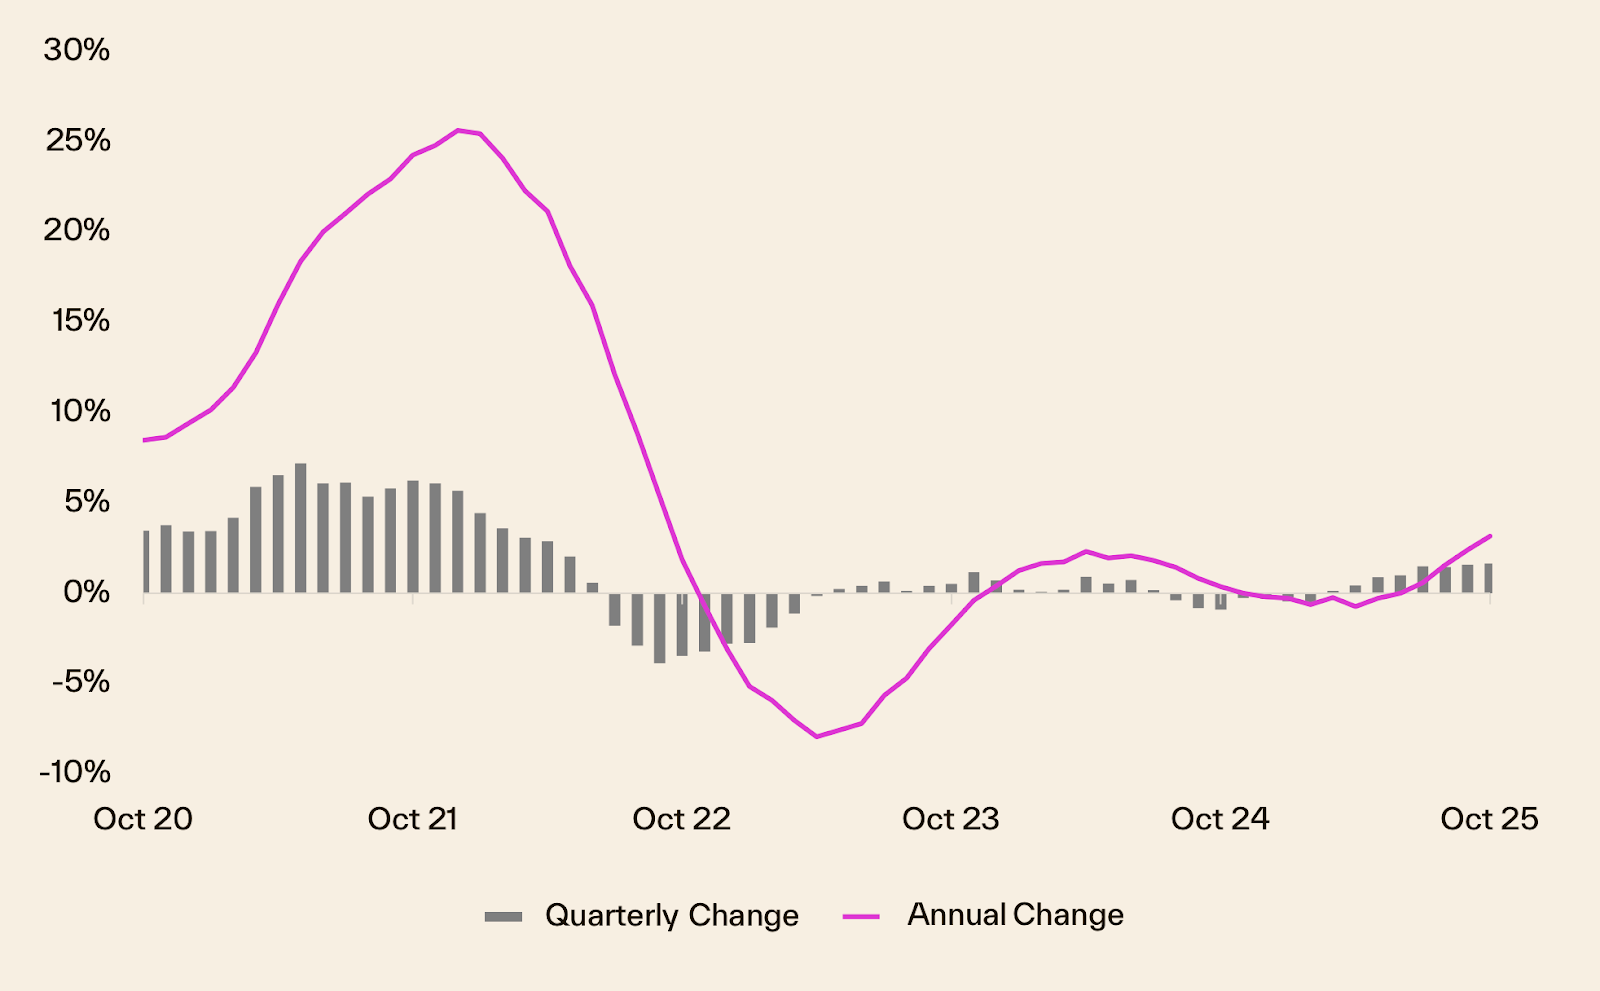
Canberra home values were unchanged over the month in April 2026, recording a flat +0.0 per cent monthly result while posting a modest +0.4 per cent gain for the quarter. The standout figure is the annual change, with values up +5.6 per cent over the year.
| Property type | Current median price | Monthly change | Quarterly change | Annual change |
|---|---|---|---|---|
| All Canberra dwellings | $898,242 | +0.0% | +0.4% | +5.6% |
Source: Cotality
The median home value in Canberra sat at $898,242 in April 2026, unchanged from the prior month's estimated $898,242. That annual gain of +5.6 per cent represents a meaningful lift in dollar terms over twelve months, even as the monthly reading paused for breath.
House prices in Canberra
Canberra house prices dipped marginally in April 2026, falling -0.1 per cent over the month, though the quarterly and annual pictures remain positive. The annual gain of +7.0 per cent puts the Canberra housing market well ahead of the national pace, where many of the larger capitals are recording flat or negative quarterly results.
| Property type | Current median price | Monthly change | Quarterly change | Annual change |
|---|---|---|---|---|
| Canberra houses | $1,049,789 | -0.1% | +0.3% | +7.0% |
Source: Cotality
With a median of $1,049,789, the monthly fall of -0.1 per cent translates to a drop of roughly $1,049 from the prior month's estimated median of $1,050,838. The +7.0 per cent annual gain is a strong result in the current environment, reflecting the relative resilience of Canberra's owner-occupier market compared to cities where affordability and rate sensitivity are biting harder.
Unit prices in Canberra
Canberra unit prices edged up +0.1 per cent in April 2026, adding to a quarterly gain of +0.8 per cent. Annual growth for Canberra unit prices, at +0.9 per cent, is the softer side of the local market story, sitting well below the house segment.
| Property type | Current median price | Monthly change | Quarterly change | Annual change |
|---|---|---|---|---|
| Canberra units | $593,303 | +0.1% | +0.8% | +0.9% |
Source: Cotality
The median unit value of $593,303 is up roughly $593 from the prior month's estimated $592,710, a modest but positive move. The gap between annual house growth of +7.0 per cent and unit growth of +0.9 per cent suggests demand has been more concentrated in the freestanding home segment, likely reflecting buyers stretching toward houses while units face softer competition.
Canberra property market forecasts 2026
Australia's Big 4 banks publish annual dwelling price forecasts as part of their economic research, and views on Canberra for 2026 differ across the group. Two of the four have published city-level figures for the ACT, while the others have not broken their forecasts down to Canberra specifically.
- CBA: CBA does not publish a separate dwelling price forecast for Canberra.
- Westpac: Westpac does not publish a separate dwelling price forecast for Canberra.
- NAB: NAB's published forecast is at the state level rather than for Canberra specifically; it predicts dwelling prices to rise +1.5 per cent over the next 12 months across the ACT.
- ANZ: ANZ predicts Canberra property prices to rise +1.6 per cent over 2026.
The two available Canberra house price forecasts, NAB at +1.5 per cent and ANZ at +1.6 per cent, sit close together, suggesting a narrow spread of opinion rather than genuine disagreement about direction. Both point to modest but positive growth, which is a relatively measured take on the Canberra house price trend given the city recorded +5.6 per cent annual dwelling growth through to April 2026. The Canberra property market predictions from the banks with ACT-level data broadly point to a cooling but not contracting year ahead.
Consultancy KPMG takes a more optimistic view than the Big 4, forecasting +4.8 per cent dwelling growth across 2026 (houses +4.7 per cent, units +4.9 per cent).
RBA cash rate forecast 2026
At its March 2026 meeting, the RBA lifted the cash rate to 4.10 per cent, up from 3.60 per cent. The decision reflected persistent inflationary pressures, a tight labour market, and rising energy costs linked to the Middle East conflict, all of which the RBA flagged as ongoing risks. Financial markets are pricing in further rate increases through the remainder of 2026, and the Big 4 banks broadly share that view.
- CBA: CBA has not published a revised cash rate forecast since the March 2026 decision, but its recent commentary points to rates remaining elevated, with the possibility of at least one further increase if inflation does not ease as expected.
- Westpac: Similar to CBA, Westpac has not released an updated forecast post-March, though its published guidance anticipates continued upward pressure on rates given the inflation and energy cost environment.
- NAB: NAB has not published a revised cash rate forecast since the latest RBA decision, but its forward guidance suggests the current tightening cycle is not yet complete, with further moves dependent on incoming inflation data.
- ANZ: ANZ has not published a revised cash rate forecast since the March 2026 decision, but its commentary points in the same direction as market pricing, which indicates at least one more increase before any stabilisation.
What this means for the Canberra market
A cash rate of 4.10 per cent means borrowing is meaningfully more expensive than it was 12 months ago, and that feeds directly into how much Canberra buyers can borrow. With Canberra house prices averaging $1,049,789, even a small reduction in borrowing capacity can push buyers down a price tier or out of the market altogether.
The modest +1.5 to +1.6 per cent price forecasts from NAB and ANZ reflect exactly that pressure. Higher rates tend to compress the top end of the market hardest, while more affordable segments, Canberra units at a median of $593,303 are a relevant example, may hold up better as buyers recalibrate their price points. First-home buyers working within tighter serviceability limits are likely to feel the rate environment most acutely.
Several of the Big 4 forecasts predate the March 2026 rate decision, so the full effect of that increase may not yet be reflected in their published figures. Bank views may be revised in coming months as more post-hike data becomes available.
Canberra house prices graphs and charts
Canberra's house price growth over the last 5 years has seen its share of ups and downs. As of November 2025, dwelling values increased by +0.6 per cent for the month, +1.7 per cent for the quarter, and are +3.2 per cent higher than a year ago. However, they are still about -3.5 per cent below their peak in May 2022.
The five-year chart highlights a sharp rise during the COVID era, followed by a prolonged correction starting in 2022. Since then, rolling quarterly growth has been nearly flat, with recent data showing no significant recovery in momentum.
Before this slowdown, Canberra's property growth over the last ten years was quite dramatic. Prices surged by 55 per cent during the COVID boom, climbing from $720,000 to over $1.1 million by the end of 2021. This was fuelled by record-low interest rates and a demand for larger homes. However, the market then faced steep rate hikes, builder collapses, and tighter borrowing conditions, reshaping how buyers and sellers approach the market. Today, the focus is more on long-term value rather than quick gains.
This kind of stop-start cycle is typical for Canberra. The market tends to pause rather than crash, influenced by public-sector hiring, land supply constraints, and tight rental conditions. While prices are still below their peak, there are early signs of stabilisation.
Canberra selling statistics
Canberra's selling market is showing a clear split: sales activity has picked up sharply from a year ago, yet the conditions under which properties are trading have become noticeably harder for sellers. Homes are selling more slowly, vendors are giving more ground on price, and auction results are weak. More supply is leaving the market than entering it, which is tightening buyer choice but not translating into the kind of competition that drives strong results.
Canberra sales volume and days on market
Sales volumes in Canberra rose +9.8 per cent year on year, well ahead of both the combined capitals (+2.9 per cent) and the national figure (+4.7 per cent). Despite that gain in volume, properties are taking longer to sell: the median days on market sits at 43 days, down from 56 days a year ago but still considerably slower than the combined capitals average of 27 days and the national average of 30 days.
| Canberra sales volume | Canberra days on market |
|---|---|
| +9.8% Change from 12mo ago | 43 days 56 days 12 mo ago |
Source: Cotality
Canberra's pace of sale is the slowest of any benchmark shown here, sitting more than a fortnight behind the combined capitals average. That gap tells buyers they have more time to consider their options in Canberra than in most other major cities, while sellers should expect a longer campaign before a sale is secured.
Canberra new and total listings
New listings fell sharply, down -16.0 per cent year on year, meaning fresh stock is entering the Canberra market at a significantly reduced rate. Total listings are also down, by -7.3 per cent year on year, so the overall pool of available homes has shrunk even as volumes have risen.
| Canberra new listings | Canberra total listings |
|---|---|
| -16.0% Change from 12mo ago | -7.3% Change from 12mo ago |
Source: Cotality
For buyers, a tighter total listings figure means less choice and more competition for the properties that do come to market. Yet the slow days-on-market figures suggest that competition is not yet translating into urgency at the negotiating table, which points to a market where supply and demand are tightening but buyer confidence remains cautious.
Canberra vendor discount and auction clearance rates
Vendor discount measures the percentage gap between a property's initial asking price and what it actually sells for, a wider number means sellers are conceding more to get a deal done. Auction clearance rates capture what share of properties offered at auction actually sell on the day, reflecting how willing buyers are to compete in real time. Together, these two measures give a clear read on who holds the balance of power in the current market.
Canberra vendor discount over time
| Mar 2026 | Mar 2025 | |
|---|---|---|
| Canberra median vendor discount | -3.2% | -2.8% |
Source: Cotality
Canberra vendors are currently discounting by -3.2 per cent, wider than the -2.8 per cent recorded a year ago. Sellers are giving up more ground than they were twelve months ago, which is consistent with the longer selling times and soft auction conditions playing out across the city.
Canberra auction clearance rates
| Canberra | 26 Apr 2026 |
|---|---|
| Total Auctions | 29 |
| Sold | 14 |
| Withdrawn | 1 |
| Passed in | 13 |
| Clearance Rate | 50.0% |
Source: Cotality
Canberra's clearance rate for the week ending 26 April 2026 came in at 50.0 per cent, with 14 of 28 reported results selling under the hammer. A rate at this level sits firmly in buyer-favourable territory: by long-run Cotality benchmarks, a genuine balance between buyers and sellers sits closer to 65 to 70 per cent, so a result of 50.0 per cent signals that buyers hold a clear upper hand at auction right now.
Get a deeper insight into how Canberra sellers are faring in 2026 and what could be on the horizon for the remainder of the year with some of our latest articles.


Canberra property investing
Canberra's rental market is navigating a period of steady, if modest, pressure. Renters are facing rising rents and limited choice, while investors are enjoying a yield profile that compares favourably to most major capitals.
Canberra rental market
The table below sets out annual rent growth figures and gross rental yields for Canberra and other capital cities, including a breakdown of house and unit rent changes where data is available.
| Location | Rental rates | Rental yield | Annual change in rents, houses | Annual change in rents, units |
|---|---|---|---|---|
| National | 5.7% | 3.6% | NA | NA |
| Combined Capitals | 5.6% | 3.4% | NA | NA |
| Combined Regional | 6.0% | 4.2% | NA | NA |
| Sydney | 5.9% | 3.1% | 6.0% | 5.5% |
| Melbourne | 4.4% | 3.7% | 4.3% | 4.9% |
| Brisbane | 6.7% | 3.3% | 6.5% | 6.4% |
| Adelaide | 3.6% | 3.4% | 3.2% | 3.7% |
| Perth | 6.7% | 3.7% | 7.0% | 7.4% |
| Hobart | 6.4% | 4.3% | 7.0% | 5.5% |
| Darwin | 9.2% | 6.0% | 8.8% | 9.8% |
| Canberra | 2.6% | 4.0% | 3.3% | 2.0% |
Source: Cotality
Canberra's annual rent growth of +2.6 per cent is the slowest of any capital city, sitting well below the national figure of +5.7 per cent. At the same time, a gross yield of 4.0 per cent places Canberra ahead of Sydney, Melbourne, Brisbane, Adelaide and Perth, a reflection of property values that, while high in absolute terms, have not run as far ahead of rents as in those larger cities. Houses have seen stronger rental growth (+3.3 per cent) than units (+2.0 per cent), suggesting the unit market in particular is under comparatively little upward pressure right now.
Canberra vacancy rates
The vacancy rate is a straightforward measure of how many rental properties are sitting empty at any given time. A lower rate means fewer options for renters and more pricing power for landlords. SQM Research data shows Canberra's vacancy rate has tightened from 1.5 per cent a year ago to 1.1 per cent in April 2026, a meaningful shift that signals improving conditions for property owners.
| Location | Mar 2026 vacancy rates | Mar 2026 vacancies | Mar 2025 vacancy rates | Mar 2025 vacancies |
|---|---|---|---|---|
| National | 1.0% | 31,732 | 1.1% | 34,428 |
| Sydney | 1.1% | 8,469 | 1.3% | 9,412 |
| Melbourne | 1.4% | 7,549 | 1.5% | 8,194 |
| Brisbane | 0.8% | 2,662 | 0.9% | 3,207 |
| Adelaide | 0.7% | 1,071 | 0.6% | 988 |
| Perth | 0.5% | 988 | 0.6% | 1,091 |
| Hobart | 0.4% | 121 | 0.5% | 148 |
| Darwin | 0.4% | 93 | 0.8% | 210 |
| Canberra | 1.1% | 700 | 1.5% | 909 |
Source: SQM Research
At 1.1 per cent, Canberra's vacancy rate now matches Sydney's and sits above the national rate of 1.0 per cent, making it one of the less acute rental markets in the country relative to cities like Perth, Hobart and Darwin. The year-on-year drop from 1.5 per cent to 1.1 per cent, representing 209 fewer vacant properties, shows the market is tightening despite that relative position. Adelaide's rate has moved in the opposite direction, nudging up from 0.6 per cent to 0.7 per cent, which is worth noting as an outlier in an otherwise broadly tightening national picture.
Louis Christopher, Managing Director at SQM Research said in the latest SQM rental market report:
"The national vacancy rate dropping to 1.0% highlights just how tight Australia's rental market has become. We are now seeing vacancy rates at critically low levels in several cities, particularly Perth, Darwin and Hobart."
Canberra is not among the cities facing the most acute rental pressure, but the direction of travel is clear, fewer vacancies, tighter conditions and, over time, upward pressure on asking rents. For investors already holding Canberra property, a vacancy rate falling toward the national floor, combined with a yield above 4.0 per cent, represents a more favourable income picture than many higher-profile markets can currently offer.
Highest growth areas in Canberra
Canberra's top annual price gains in April 2026 came from a spread of districts across the territory rather than a single concentrated corridor. The table below ranks all eight available Statistical Area Level 3 (SA3) regions for the ACT, an ABS classification that typically groups several adjacent suburbs into a single geographic unit, by their annual percentage change in dwelling values.
| Rank | SA3 Name | SA4 Name | Median Value | Annual % Change |
|---|---|---|---|---|
| 1 | Weston Creek | ACT | $997,128 | +10.1% |
| 2 | Tuggeranong | ACT | $909,137 | +7.5% |
| 3 | Belconnen | ACT | $875,394 | +6.4% |
| 4 | Woden Valley | ACT | $1,019,294 | +4.5% |
| 5 | Gungahlin | ACT | $912,964 | +4.3% |
| 6 | South Canberra | ACT | $969,272 | +4.1% |
| 7 | Molonglo | ACT | $750,132 | +3.9% |
| 8 | North Canberra | ACT | $697,131 | +3.4% |
Source: Cotality
Highlights for Canberra’s high growth areas
- Weston Creek: Ranked #1 across Canberra's SA3 regions with annual growth of +10.1 per cent and a median value of $997,128, Weston Creek is outpacing the rest of the territory by a clear margin. Its position on the southern side of the lake, with established amenity and relatively accessible pricing compared with inner-south alternatives, appears to be drawing strong buyer interest.
- Tuggeranong: Ranked #2 with annual growth of +7.5 per cent and a median value of $909,137, Tuggeranong sits well below the Woden Valley and South Canberra medians despite comparable or better growth. That combination of relative affordability and solid capital gain is likely attracting buyers who want value without venturing far from the city's services.
- Belconnen: Ranked #3 with +6.4 per cent annual growth and a median value of $875,394, Belconnen is the most affordable of the top three SA3 regions by median. Its mix of established housing, tertiary education infrastructure and proximity to town centre amenity continues to support demand from a broad range of buyers.
- Woden Valley and Gungahlin: Ranks #4 and #5, Woden Valley (+4.5 per cent, $1,019,294) and Gungahlin (+4.3 per cent, $912,964), represent quite different parts of the city yet sit within a whisker of each other on growth. Woden Valley carries the highest median of any SA3 in this table, suggesting demand there is holding despite the premium price point, while Gungahlin's newer residential stock and ongoing population growth in Canberra's north continue to underpin steady gains.
- South Canberra, Molonglo and North Canberra: Ranks #6 through #8, South Canberra (+4.1 per cent, $969,272), Molonglo (+3.9 per cent, $750,132) and North Canberra (+3.4 per cent, $697,131), round out the table with more moderate but still positive annual growth. North Canberra's $697,131 median is the lowest of all eight SA3 regions, making it one of the more accessible entry points into the capital's property market.
View agent & property tools

Our powerful property tools

