
 - https://sketchapp.com --%3e %3ctitle%3eIcon/search%3c/title%3e %3cdesc%3eCreated with Sketch.%3c/desc%3e %3cg id='Icon/search' stroke='none' stroke-width='1' fill='none' fill-rule='evenodd' stroke-linecap='round' stroke-linejoin='round'%3e %3ccircle id='Oval' stroke='%23252525' cx='10.5145111' cy='10.5145111' r='6.99455261'%3e%3c/circle%3e %3cpath d='M15.4908752%2c15.4908752 L20.5515137%2c20.5515137' id='Line' stroke='%23252525'%3e%3c/path%3e %3c/g%3e%3c/svg%3e)

Darwin property market news - key takeaways
- Darwin property market at record high: Darwin dwelling values rose +1.4 per cent in June 2026 and +19.8 per cent over the year, the strongest annual gain of any Australian capital city, with the median now sitting at $638,187.
- Listings absorbed as fast as they arrive: New listings grew +5.2 per cent year on year, yet total stock barely moved at -0.2 per cent, pointing to buyers absorbing incoming supply at roughly the same pace sellers list.
- Properties selling faster than a year ago: The median days on market fell to 34 days in June 2026, down from 43 days a year earlier, with vendors also closing within a narrower discount of -2.8 per cent against their asking price.
- Rental conditions among tightest in the country: Darwin's vacancy rate dropped to just 0.3 per cent with only 64 properties vacant city-wide, driving annual rent growth of +10.1 per cent, the highest of any capital city.
- Rate outlook split among major banks: With the RBA cash rate at 4.35 per cent, three of the four major banks expect cuts by mid-to-late 2027, while Westpac forecasts further rises, leaving the near-term borrowing cost environment genuinely uncertain.

Get a free property value estimate
Find out how much your property is worth in today’s market.
Darwin property price movements
The Darwin property market closed the June 2026 quarter at a record high, with values climbing across all property types. Growth has been broad-based, covering houses and units alike.
Darwin property prices - June 2026
Darwin values rose +1.4 per cent over the month in June 2026, with the quarterly and annual figures telling an even stronger story. The +5.0 per cent quarterly gain and +19.8 per cent annual gain are the strongest of any capital city over both periods.
| Property type | Current median price | Monthly change | Quarterly change | Annual change |
|---|---|---|---|---|
| All Darwin dwellings | $638,187 | +1.4% | +5.0% | +19.8% |
Source: Cotality
The median home value in Darwin now sits at $638,187, up around $8,800 on the prior month. Darwin values are at a record high.
House prices in Darwin
Darwin house prices posted a solid month in June 2026, with the median rising +1.2 per cent. The +19.3 per cent annual gain confirms that the Darwin housing market has been one of the country's standout performers over the past year.
| Property type | Current median price | Monthly change | Quarterly change | Annual change |
|---|---|---|---|---|
| Darwin houses | $766,350 | +1.2% | +5.4% | +19.3% |
Source: Cotality
The typical Darwin house now has a median value of $766,350, roughly $9,100 higher than the month prior. The quarterly gain of +5.4 per cent is the stronger of the two property types over that period, suggesting houses have been the bigger driver of the quarterly run.
Unit prices in Darwin
Darwin unit prices added +1.6 per cent in June 2026, the faster of the two monthly moves. Darwin unit prices have climbed +20.9 per cent over the year, edging ahead of the house segment on an annual basis.
| Property type | Current median price | Monthly change | Quarterly change | Annual change |
|---|---|---|---|---|
| Darwin units | $472,572 | +1.6% | +4.3% | +20.9% |
Source: Cotality
The Darwin unit median reached $472,572 in June 2026, around $7,400 above the prior month. At +4.3 per cent for the quarter, units grew a touch more slowly than houses over the three-month period, though both segments recorded gains well above any other capital city.
Darwin property market forecasts 2026
Australia's Big Four banks publish dwelling price forecasts as part of their annual economic research, and their views on Darwin for 2026 vary considerably. Westpac does not publish a separate dwelling price forecast for Darwin, so the comparison below covers the three banks that do.
- CBA predicts Darwin property prices to rise +4.0 per cent over 2026.
- Westpac does not publish a separate dwelling price forecast for Darwin.
- NAB's published forecast is at the Northern Territory state level; it predicts dwelling prices to rise +7.9 per cent over the next 12 months across the Northern Territory.
- ANZ predicts Darwin property prices to rise +8.0 per cent over 2026.
Among the banks publishing Darwin-specific forecasts, ANZ sits at the optimistic end of the Darwin house price forecast range at +8.0 per cent, while CBA is the most conservative at +4.0 per cent. NAB's Northern Territory figure of +7.9 per cent sits close to ANZ's end of the spread, though it covers the broader Territory rather than Darwin specifically and cannot be read as a Darwin property market prediction. The gap between CBA and ANZ is four percentage points, a meaningful spread that reflects genuine uncertainty about the pace of Darwin's current growth cycle.
RBA cash rate forecast 2026
The RBA cash rate currently sits at 4.35 per cent. The major banks are not aligned on where rates go from here: three of the four expect the next move to be a cut, while Westpac stands apart in forecasting a rise. That split is worth noting when reading Darwin house price trend expectations alongside the rate outlook.
According to Canstar:
- ANZ predicts that we’ll see 25 basis point cuts in September and December of 2027, bringing the cash rate to 3.85% by the end of next year.
- CBA predicts that we’ll see 25 basis point cuts in May and August of 2027, bringing the cash rate to 3.85% by the third quarter of next year.
- NAB predicts that we’ll see 25 basis point cuts in June, September and December of 2027, bringing the cash rate to 3.60% by the end of next year.
- Westpac currently predicts two more 25 basis point hikes in August and September, bringing the cash rate to 4.85%.
What this means for the Darwin market
At 4.35 per cent, the cash rate continues to shape how much buyers can borrow, and Darwin's relatively lower median values mean rate sensitivity here plays out differently than in Sydney or Melbourne. Borrowing capacity is still constrained compared to a pre-2022 environment, but Darwin's entry-level price point keeps monthly repayments more manageable for many buyers.
The rate forecast divergence adds a layer of genuine uncertainty to Darwin's near-term outlook. If the cutting scenario most banks expect plays out through 2027, it would ease borrowing costs and likely support demand in a market already running at record highs. Westpac's alternative scenario of further rises would present a stiffer test, particularly for investors who have been active participants in Darwin's rental market.
NAB's forecast predates the most recent months of Darwin's strong quarterly performance, so its Northern Territory figure may not fully reflect the city's current momentum and could be revised in coming months.
Helpful resource: Our simple guide to tracking market trends and data will walk you through everything you need to know to be able to read the market and make a smarter selling decision.
Darwin house prices graphs and charts
Darwin's house price growth over the last 5 years has continued to build momentum, with dwelling values rising +1.4 per cent over the month, +5.0 per cent over the quarter, and +19.8 per cent over the year to June 2026, according to Cotality's latest figures, placing the current dwelling median at $638,187. Darwin now sits at a record high, making it one of only two capital cities still posting positive growth across both monthly and quarterly measures in the current cycle.
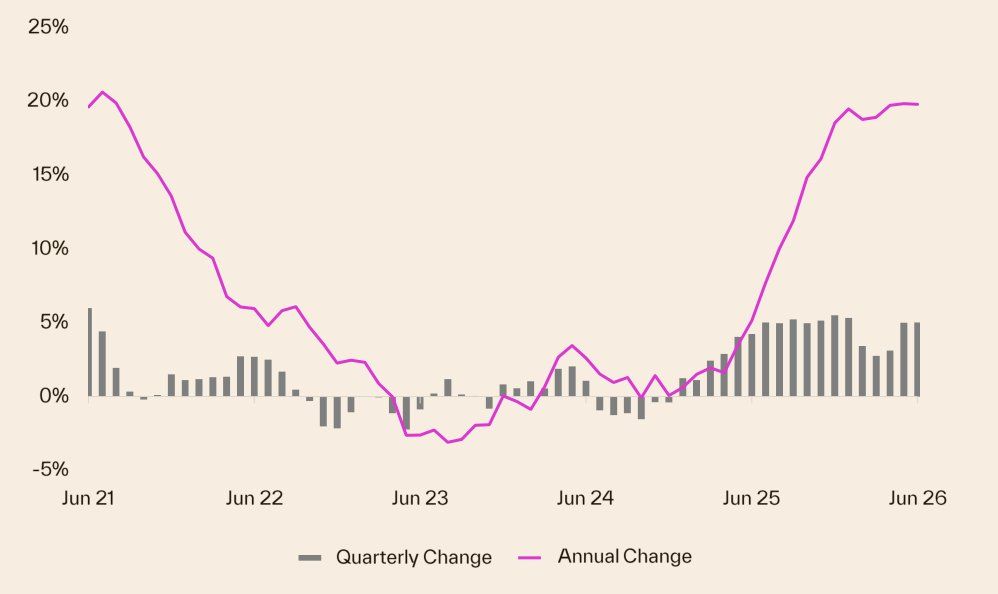
Darwin's five-year run has been shaped by a combination of tight housing supply, strong interstate migration, and an affordability profile that still looks accessible against Sydney and Melbourne, even after the gains of recent years. With the cash rate holding at 4.35 per cent and lending conditions remaining firm, the buyers driving Darwin's growth have largely been owner-occupiers and yield-focused investors attracted by the city's rental returns, rather than speculative demand chasing momentum.
Darwin selling statistics
Selling conditions in Darwin are running well ahead of most other Australian capital cities. Transaction volumes are up sharply, properties are moving faster than a year ago, and the gap between asking prices and sale prices has narrowed, all signs that buyer demand remains firm.
Want to know what your own property is worth? Get a free value estimate for your address.
Darwin sales volume and days on market
Darwin sales volumes rose +17.8 per cent year on year in June 2026, a result that sits in sharp contrast to the combined capitals, where volumes slipped -0.7 per cent over the same period, and to the national figure of +2.1 per cent. The median time to sell fell to 34 days, down from 43 days a year earlier.
| Darwin sales volume | Darwin days on market |
|---|---|
| +17.8% Change from 12mo ago | 34 days 43 days 12 mo ago |
Source: Cotality
Darwin's days-on-market figure of 34 days sits slightly above the combined capitals median of 30 days and the national median of 32 days, but the year-on-year improvement of nine days tells a clearer story: properties are moving considerably faster than they were 12 months ago. For sellers, that compression in selling time points to a pool of active buyers willing to commit.
Darwin new and total listings
New listings in Darwin grew +5.2 per cent year on year, meaning more sellers are choosing to test the market. Total listings, though, were essentially flat, edging down just -0.2 per cent over the same period.
| Darwin new listings | Darwin total listings |
|---|---|
| +5.2% Change from 12mo ago | -0.2% Change from 12mo ago |
Source: Cotality
The combination of rising new supply and a near-unchanged total stock figure suggests that incoming listings are being absorbed by buyers at roughly the same pace they arrive. That absorption pattern keeps the balance between buyer choice and seller competition relatively tight, which supports the price momentum seen elsewhere in Darwin's data.
Darwin vendor discount
Vendor discount measures the percentage difference between a property's initial asking price and its final sale price. A narrower discount means sellers are achieving prices closer to what they originally asked. Weekly auction clearance rates are not reported for Darwin because auction volumes are too low to produce statistically meaningful results.
| June 2026 | June 2025 | |
|---|---|---|
| Darwin median vendor discount | -2.8% | -3.2% |
Source: Cotality
Darwin's vendor discount narrowed to -2.8 per cent in June 2026, compared with -3.2 per cent a year earlier. Sellers are closing within a smaller margin of their asking price than they were 12 months ago, consistent with the stronger sales volumes and faster selling times recorded across the same period.
Thinking of selling? Compare top-performing local agents in your suburb to find the right fit for your sale.
Get a deeper insight into how Darwin sellers are faring in 2026 and what could be on the horizon for the remainder of the year with some of our latest articles.


Darwin property investing
Darwin's rental market is one of the tightest and highest-yielding in the country, making it an unusually strong income story for investors at a time when yields in the southern capitals remain compressed. Renters, on the other hand, are facing some of the sharpest rent increases of any Australian city.
Helpful resource: Estimate the capital gains tax on a sale with our free calculator.
Darwin rental market
The table below covers annual rental growth, gross rental yield, and the split between houses and units for Darwin and the other capital cities. These figures give a clear picture of where Darwin sits relative to the broader national market.
| Location | Rental rates | Rental yield | Annual change in rents, houses | Annual change in rents, units |
|---|---|---|---|---|
| National | 5.9% | 3.7% | NA | NA |
| Combined Capitals | 6.0% | 3.5% | NA | NA |
| Combined Regional | 5.9% | 4.2% | NA | NA |
| Sydney | 5.9% | 3.3% | 6.6% | 4.7% |
| Melbourne | 4.9% | 3.9% | 4.9% | 4.8% |
| Brisbane | 6.4% | 3.3% | 6.6% | 5.8% |
| Adelaide | 4.8% | 3.5% | 4.9% | 4.3% |
| Perth | 7.8% | 3.7% | 7.9% | 7.6% |
| Hobart | 8.6% | 4.4% | 9.1% | 6.6% |
| Darwin | 10.1% | 6.1% | 10.8% | 9.0% |
| Canberra | 3.2% | 4.2% | 3.9% | 1.7% |
Source: Cotality
Darwin posted the strongest annual rental growth of any capital city at +10.1 per cent, with houses leading at +10.8 per cent and units not far behind at +9.0 per cent. Its gross yield of 6.1 per cent is the highest of any capital, sitting well clear of second-placed Hobart at 4.4 per cent. That yield gap reflects a market where rents have run hard against property values that, while rising strongly, remain considerably lower than Sydney or Melbourne in absolute terms.
Darwin vacancy rates
Vacancy rates measure the share of rental properties sitting empty at a given time. A lower rate signals stronger competition among renters for available stock, which tends to push rents up. SQM data shows that Darwin's vacancy rate has fallen sharply over the past year.
| Location | June 2026 vacancy rates | June 2026 vacancies | June 2025 vacancy rates | June 2025 vacancies |
|---|---|---|---|---|
| National | 1.3% | 39,229 | 1.3% | 39,027 |
| Sydney | 1.6% | 11,957 | 1.6% | 11,482 |
| Melbourne | 1.6% | 8,640 | 1.8% | 9,414 |
| Brisbane | 0.9% | 3,065 | 0.9% | 3,147 |
| Adelaide | 0.7% | 1,096 | 0.8% | 1,268 |
| Perth | 0.6% | 1,247 | 0.8% | 1,457 |
| Hobart | 0.7% | 185 | 0.6% | 175 |
| Darwin | 0.3% | 64 | 0.5% | 115 |
| Canberra | 1.7% | 1,063 | 1.5% | 920 |
Source: SQM Research
Darwin's vacancy rate of 0.3 per cent is the lowest of any capital city tracked, and a meaningful drop from 0.5 per cent a year ago. In absolute terms, just 64 rental properties were vacant across the entire city, down from 115 a year earlier. That is an exceptionally thin pool of available stock for a city of Darwin's size, and it explains directly why rents are climbing faster here than anywhere else in the country.
Louis Christopher, Managing Director at SQM Research said in the latest rental market report:
"While the national vacancy rate has edged up to 1.3%, Australia's rental market remains exceptionally tight by historical standards. Most capital cities continue to record vacancy rates below one per cent or only marginally above, highlighting that rental supply remains insufficient to meet demand."
Darwin sits well below even those already-tight benchmarks that Mr Christopher describes. With a vacancy rate less than a quarter of the national figure and available stock at just 64 properties, the rental supply gap in Darwin is more pronounced than in any other capital. For investors, that level of constraint points to continued upward pressure on rental income, provided new supply does not enter the market at pace.
Highest growth areas in Darwin
Darwin has only three SA3 regions, Statistical Area Level 3 classifications, an ABS boundary that typically covers several adjacent suburbs, and all three recorded strong annual growth through June 2026. The table below ranks each by annual percentage change in dwelling values.
| Rank | SA3 Name | SA4 Name | Median Value | Annual % Change |
|---|---|---|---|---|
| 1 | Palmerston | Darwin | $676,175 | +21.1% |
| 2 | Darwin Suburbs | Darwin | $639,575 | +18.9% |
| 3 | Darwin City | Darwin | $554,496 | +17.7% |
- Palmerston: Ranked #1 across Darwin's SA3 regions, Palmerston recorded annual growth of +21.1 per cent in June 2026, reaching a median value of $676,175. It is Darwin's fastest-growing corridor, drawing buyers with relatively newer housing stock and greater land availability than the inner city, with suburbs such as Moulden and Zuccoli among the more active pockets.
- Darwin Suburbs: Ranked #2 with annual growth of +18.9 per cent and a median value of $639,575, Darwin Suburbs covers the established residential belt surrounding the city centre. Demand here is supported by access to amenities, schools, and employment hubs, keeping buyer interest broad across the region.
- Darwin City: Ranked #3 with annual growth of +17.7 per cent and a median value of $554,496, Darwin City offers the most affordable entry point of the three SA3 regions. The area, which includes the Darwin City suburb itself, benefits from proximity to government employment and the waterfront precinct, and its lower price point relative to Palmerston continues to attract buyers.
- The strength across all three SA3 regions: Palmerston, Darwin Suburbs, and Darwin City each recorded annual gains of more than +17 per cent, making Darwin one of the strongest-performing capital city markets in the country over the past year. Tight rental vacancy, steady population growth from interstate migration, and a constrained supply of new dwellings have all contributed to upward price pressure across the entire market.
- Affordability as a common thread: With median values ranging from $554,496 to $676,175, all three Darwin SA3 regions remain well below the median price levels seen in Sydney or Melbourne, a gap that continues to underpin buyer interest from interstate investors and owner-occupiers alike seeking relative value.
Thinking of selling or investing in Darwin? Compare local agents or get a free property report with OpenAgent.
View agent & property tools

Our powerful property tools

