
 - https://sketchapp.com --%3e %3ctitle%3eIcon/search%3c/title%3e %3cdesc%3eCreated with Sketch.%3c/desc%3e %3cg id='Icon/search' stroke='none' stroke-width='1' fill='none' fill-rule='evenodd' stroke-linecap='round' stroke-linejoin='round'%3e %3ccircle id='Oval' stroke='%23252525' cx='10.5145111' cy='10.5145111' r='6.99455261'%3e%3c/circle%3e %3cpath d='M15.4908752%2c15.4908752 L20.5515137%2c20.5515137' id='Line' stroke='%23252525'%3e%3c/path%3e %3c/g%3e%3c/svg%3e)

Hobart property market news - key takeaways
- Values rising across the board: The Hobart property market posted +0.6 per cent monthly growth in June 2026, extending gains across houses and units, with the annual figure of +9.3 per cent placing Hobart among the stronger-performing capitals.
- Stock is exceptionally tight: Total listings fell -24.4 per cent year on year, meaning buyers have far less choice than twelve months ago, a key factor supporting the city's price growth.
- Properties selling fast: Hobart's median days on market was 30 days in June 2026, one day faster than a year ago and level with the combined capitals, while vendor discount widened only modestly to -4.1 per cent.
- Rental pressure remains intense: Hobart rents rose +8.6 per cent over the year, the second highest annual growth of any capital city, with a vacancy rate of just 0.7 per cent keeping rental supply very thin.
- Rate outlook mixed: The RBA cash rate sits at 4.35 per cent, with three of the Big Four banks expecting cuts from mid-2027, though Westpac forecasts further rises that could push the rate to 4.85 per cent.

Get a free property value estimate
Find out how much your property is worth in today’s market.
Hobart property price movements
The Hobart property market continued to gain ground in June 2026, with values rising across all property types over the month, the quarter, and the year. Growth has been broad-based, with both houses and units contributing to the upswing.
Hobart property prices - June 2026
Hobart home values rose +0.6 per cent over the month in June 2026, extending a run of quarterly and annual gains. The annual figure of +9.3 per cent stands out as one of the stronger results among Australian capital cities.
| Property type | Current median price | Monthly change | Quarterly change | Annual change |
|---|---|---|---|---|
| All Hobart dwellings | $752,760 | +0.6% | +1.4% | +9.3% |
Source: Cotality
The median value of Hobart homes lifted by around $4,498 over the month, reaching $752,760. Values remain -0.7 per cent below their March 2022 peak, meaning the market has largely recovered the ground lost since that high point but has not yet cleared it.
House prices in Hobart
Hobart house prices rose +0.6 per cent in June 2026, matching the pace seen across all property types. The annual gain of +9.7 per cent places Hobart housing market performance well above the national average for capital cities.
| Property type | Current median price | Monthly change | Quarterly change | Annual change |
|---|---|---|---|---|
| Hobart houses | $803,094 | +0.6% | +1.3% | +9.7% |
Source: Cotality
The median house value added around $4,794 over the month to reach $803,094. The quarterly gain of +1.3 per cent points to a market that has been building pace steadily, rather than relying on a single strong month.
Unit prices in Hobart
Hobart unit prices edged up +0.4 per cent in June 2026, a slightly softer monthly result than houses but still a positive move. Annual growth of +7.5 per cent shows Hobart unit prices have also moved meaningfully higher over the past year.
| Property type | Current median price | Monthly change | Quarterly change | Annual change |
|---|---|---|---|---|
| Hobart units | $587,749 | +0.4% | +2.1% | +7.5% |
Source: Cotality
The median unit value gained around $2,349 over the month, reaching $587,749. Units posted a stronger quarterly result than houses, up +2.1 per cent against +1.3 per cent, suggesting the unit segment picked up some momentum through the June quarter even as the monthly pace was a touch softer.
Hobart property market forecasts 2026
Australia's Big Four banks publish annual dwelling price forecasts as part of their economic research, and their views on Hobart for 2026 vary considerably. The spread reflects genuine uncertainty about how the rate environment and Tasmania's tight supply conditions will play out over the remainder of the calendar year.
- CBA predicts Hobart property prices to rise +5.0 per cent over 2026.
- Westpac predicts Hobart property prices to rise +1.0 per cent over 2026.
- NAB's published forecast is at the Tasmania state level; it predicts dwelling prices to rise +3.4 per cent over the next 12 months across Tasmania.
- ANZ predicts Hobart property prices to rise +3.7 per cent over 2026.
The Hobart house price forecast spread runs from Westpac's +1.0 per cent at the cautious end to CBA's +5.0 per cent at the optimistic end. ANZ's +3.7 per cent sits near the upper half of that range, while NAB's Tasmania state figure of +3.4 per cent falls close to the midpoint. CBA and ANZ both point to meaningful growth, though Westpac's considerably more cautious view is a reminder that the rate environment creates real uncertainty for any single number.
RBA cash rate forecast 2026
The RBA held the cash rate at 4.35 per cent as at the most recent available decision, with inflation still running above target and the case for near-term cuts remaining limited. The major banks disagree on where the cash rate goes next, three of the four expect the next move to be a cut, though Westpac stands apart, forecasting rate rises rather than reductions.
According to Canstar:
- ANZ predicts that we’ll see 25 basis point cuts in September and December of 2027, bringing the cash rate to 3.85% by the end of next year.
- CBA predicts that we’ll see 25 basis point cuts in May and August of 2027, bringing the cash rate to 3.85% by the third quarter of next year.
- NAB predicts that we’ll see 25 basis point cuts in June, September and December of 2027, bringing the cash rate to 3.60% by the end of next year.
- Westpac currently predicts two more 25 basis point hikes in August and September, bringing the cash rate to 4.85%.
What this means for the Hobart market
At 4.35 per cent, the cash rate is already putting pressure on borrowing capacity, and that affects Hobart buyers meaningfully given the city's median dwelling value of $752,760. Every 25 basis points of additional rate movement shifts what buyers can borrow, and with Westpac forecasting the rate could reach 4.85 per cent, some buyers may find their capacity tighter than they expect.
For those banking on rate cuts to improve affordability, the earliest relief scenario, CBA's May 2027 cut, is still the better part of a year away. That gap matters for first-home buyers and upgraders alike, since Hobart's price growth of +9.3 per cent over the past year has already moved values well ahead of where they were when current rate settings began to bite.
The wide gap between Westpac's +1.0 per cent price forecast and CBA's +5.0 per cent largely tracks the banks' divergent rate assumptions. If Westpac's rate path is correct and the cash rate rises to 4.85 per cent, the more modest growth outcome becomes easier to understand. Hobart's unit market, with a median of $587,749, may prove more resilient across both scenarios given its lower entry point, while house buyers face the sharper affordability calculation at $803,094.
Westpac's price and rate forecasts both predate the most recent available RBA decision, so its views may be revised as the rate picture clarifies in coming months.
Helpful resource: Our simple guide to tracking market trends and data will walk you through everything you need to know to be able to read the market and make a smarter selling decision.
Hobart house prices graphs and charts
Hobart's house price growth over the last 5 years has kept the city firmly in positive territory, with dwelling values lifting +0.6 per cent over the month, +1.4 per cent over the quarter, and +9.3 per cent over the year to June 2026, according to Cotality's latest figures, placing the current dwelling median at $752,760.
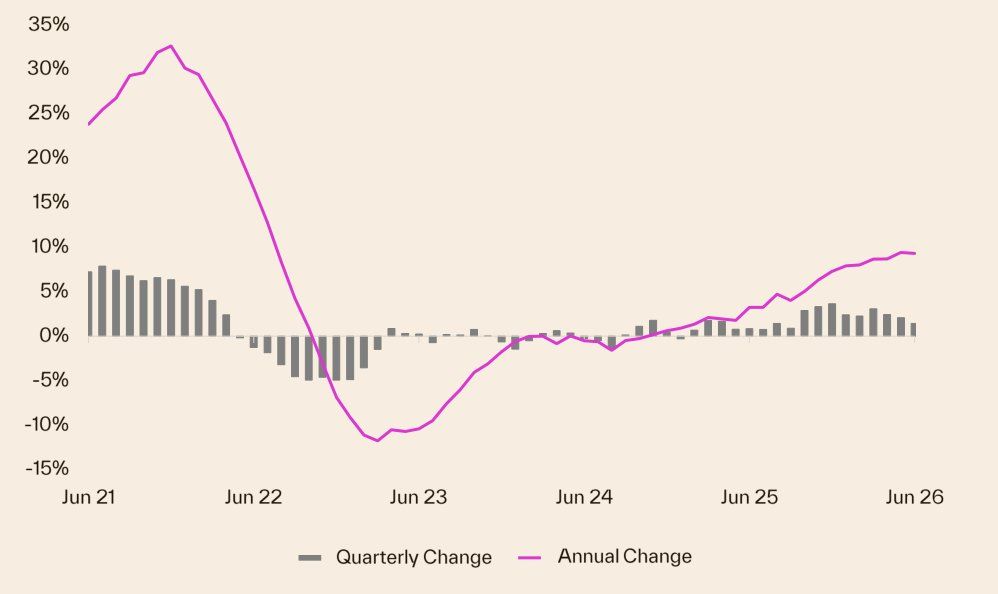
The five-year arc has been shaped by two distinct forces: a rate-driven surge through 2021 and into early 2022, followed by a period of easing as the RBA lifted borrowing costs, and then a recovery phase supported by tight supply and persistently strong demand relative to what the city can offer. Total listings in Hobart fell -24.4 per cent year on year, which goes a long way to explaining why values have continued to climb even as conditions in the larger capitals have softened.
Hobart property 30 year property price graph
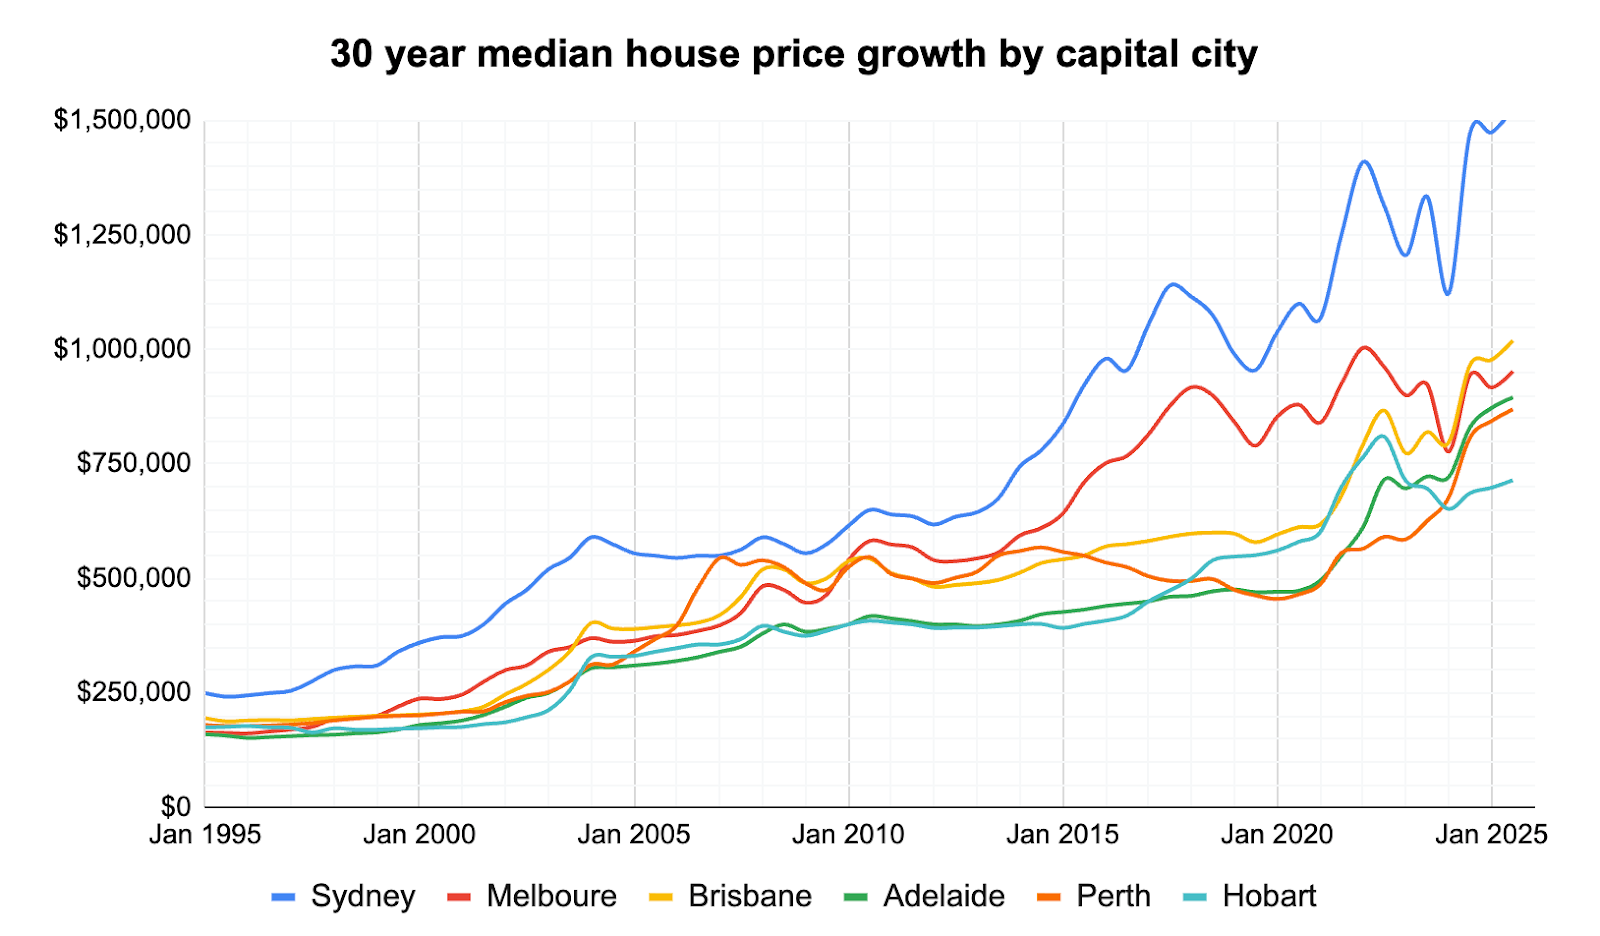
Hobart property prices growth over the last 10 years has been strong, fuelled by interstate migration, tight housing supply and rising demand for lifestyle locations—factors that powered the big gains through 2015–2021 and set the scene for the recent cycle. That decade of substantial gains means the current bounce reads as a recovery toward long‑term trends rather than a new, outsized breakout, as shown by the 30‑year indexed chart and local market history.
Over the past 30 years, Hobart’s market has moved in bursts—big gains when credit was cheap and pauses when rates rose, or supply improved—so long‑term holders have generally been rewarded despite short-term swings. Today, homeowners are cautiously optimistic as values recover and rental tightness remains, while buyers are more price‑sensitive because borrowing rules and higher mortgage costs limit budgets; that mix points to steadier, moderate growth ahead rather than a return to the extreme gains of 2021.
Hobart selling statistics
Hobart's selling-side conditions in June 2026 point to a market with genuine momentum. Sales are rising, stock is tighter than a year ago, and properties are moving at a pace that matches the combined capitals, a solid result for a smaller capital.
Want to know what your own property is worth? Get a free value estimate for your address.
Hobart sales volume and days on market
Sales volumes in Hobart rose +6.8 per cent year on year, a notably stronger result than the combined capitals, which posted -0.7 per cent, and the national figure of +2.1 per cent. Properties took a median of 30 days to sell, one day faster than the 31 days recorded a year ago.
| Hobart sales volume | Hobart days on market |
|---|---|
| +6.8% Change from 12mo ago | 28 days 31 days 12 mo ago |
Source: Cotality
Hobart's days on market of 30 days sits level with the combined capitals and two days below the national median of 32 days. For a city of Hobart's size, matching the combined-capitals pace suggests demand is absorbing available stock at a healthy rate.
Hobart new and total listings
New listings fell -9.6 per cent year on year, and total listings dropped -24.4 per cent over the same period. Fewer properties came to market, and the overall pool of available stock shrank sharply.
| Hobart new listings | Hobart total listings |
|---|---|
| -9.6% Change from 12mo ago | -24.4% Change from 12mo ago |
Source: Cotality
A -24.4 per cent drop in total listings means buyers have considerably less to choose from than they did a year ago. That reduced choice tends to support prices and seller confidence, which is consistent with the annual value growth recorded across the city.
Hobart vendor discount
Vendor discount measures the percentage gap between a property's initial asking price and the price it ultimately sells for. A wider gap means sellers are accepting offers further below their list price; a narrower gap means final sale prices are tracking closer to initial expectations. Weekly auction clearance rates are not reported for Hobart because auction volumes are too low to produce a statistically meaningful result.
| June 2026 | June 2025 | |
|---|---|---|
| Hobart median vendor discount | -4.1% | -3.8% |
Source: Cotality
Hobart's vendor discount widened slightly to -4.1 per cent from -3.8 per cent a year ago. That shift is modest, but it does suggest sellers are making slightly larger price adjustments to secure a sale than they were twelve months ago. Given the sharp fall in total listings, the movement in discount is worth watching, a tighter supply picture typically limits how far discounting drifts.
Thinking of selling? Compare top-performing local agents in your suburb to find the right fit for your sale.
Get a deeper insight into how Hobart sellers are faring in 2026 and what could be on the horizon for the remainder of the year with some of our latest articles.


Hobart property investing
Hobart's rental market is running hot on both sides of the ledger. Rents are climbing at one of the faster rates among Australian capitals, and yields are holding well above the national average, making the city an attractive proposition for investors chasing income.
Helpful resource: Estimate the capital gains tax on a sale with our free calculator.
Hobart rental market
The table below covers annual rent growth, gross rental yield, and the split between houses and units across Hobart and the other capital cities. These figures show where Hobart sits relative to the national rental picture.
| Location | Rental rates | Rental yield | Annual change in rents, houses | Annual change in rents, units |
|---|---|---|---|---|
| National | 5.9% | 3.7% | NA | NA |
| Combined Capitals | 6.0% | 3.5% | NA | NA |
| Combined Regional | 5.9% | 4.2% | NA | NA |
| Sydney | 5.9% | 3.3% | 6.6% | 4.7% |
| Melbourne | 4.9% | 3.9% | 4.9% | 4.8% |
| Brisbane | 6.4% | 3.3% | 6.6% | 5.8% |
| Adelaide | 4.8% | 3.5% | 4.9% | 4.3% |
| Perth | 7.8% | 3.7% | 7.9% | 7.6% |
| Hobart | 8.6% | 4.4% | 9.1% | 6.6% |
| Darwin | 10.1% | 6.1% | 10.8% | 9.0% |
| Canberra | 3.2% | 4.2% | 3.9% | 1.7% |
Source: Cotality
Hobart posted annual rent growth of +8.6 per cent, the second highest of any capital city and well above the national figure of +5.9 per cent. At a gross yield of 4.4 per cent, Hobart also sits above every capital except Darwin, suggesting the city's values have not yet run so far ahead of rents as to compress the income return that investors see in Sydney or Brisbane. House rents led the charge at +9.1 per cent annually, with units posting a still-solid +6.6 per cent.
Hobart vacancy rates
The vacancy rate measures how many rental properties are sitting empty at any given time. A low rate tells investors that demand for rental housing is outstripping supply, which tends to keep upward pressure on rents. SQM data shows that Hobart and the wider national market compare as follows.
| Location | June 2026 vacancy rates | June 2026 vacancies | June 2025 vacancy rates | June 2025 vacancies |
|---|---|---|---|---|
| National | 1.3% | 39,229 | 1.3% | 39,027 |
| Sydney | 1.6% | 11,957 | 1.6% | 11,482 |
| Melbourne | 1.6% | 8,640 | 1.8% | 9,414 |
| Brisbane | 0.9% | 3,065 | 0.9% | 3,147 |
| Adelaide | 0.7% | 1,096 | 0.8% | 1,268 |
| Perth | 0.6% | 1,247 | 0.8% | 1,457 |
| Hobart | 0.7% | 185 | 0.6% | 175 |
| Darwin | 0.3% | 64 | 0.5% | 115 |
| Canberra | 1.7% | 1,063 | 1.5% | 920 |
Source: SQM Research
Hobart's vacancy rate edged up from 0.6 per cent a year ago to 0.7 per cent in June 2026, representing an additional 10 properties available to rent across the city. That is a small shift, and the rate remains nearly half the national figure of 1.3 per cent, confirming that rental supply in Hobart is far tighter than the capital city average. At 185 vacant properties across the entire city, the pool of available rentals is thin by any measure.
Louis Christopher, Managing Director at SQM Research said in the latest rental market report:
"While the national vacancy rate has edged up to 1.3%, Australia's rental market remains exceptionally tight by historical standards. Most capital cities continue to record vacancy rates below one per cent or only marginally above, highlighting that rental supply remains insufficient to meet demand."
Hobart sits squarely in the group Mr Christopher describes. With a vacancy rate of 0.7 per cent, Hobart is among the cities where supply has not kept pace with demand, a condition that supports the strong rental growth the city has recorded over the past year. For investors, a market this tight means vacancy risk is low, though renters continue to face limited choice and rising asking rents.
Top growth areas in Hobart
Hobart's strongest annual price gains in June 2026 were spread across several distinct parts of the city and its surrounding areas. The table below ranks all six available Statistical Area Level 3 (SA3) regions for Greater Hobart by annual percentage change, an SA3 is an ABS geographic classification that typically groups several neighbouring suburbs together.
| Rank | SA3 Name | SA4 Name | Median Value | Annual % Change |
|---|---|---|---|---|
| 1 | Hobart - North West | Hobart | $668,145 | +15.8% |
| 2 | Sorell - Dodges Ferry | Hobart | $713,491 | +13.3% |
| 3 | Hobart - South and West | Hobart | $852,778 | +10.8% |
| 4 | Brighton | Hobart | $641,786 | +10.4% |
| 5 | Hobart - North East | Hobart | $800,099 | +7.2% |
| 6 | Hobart Inner | Hobart | $884,805 | +4.2% |
Source: Cotality
Highlights for Hobart’s top growth areas
- Hobart - North West: Ranked #1 with annual growth of +15.8 per cent and a median value of $668,145, Hobart - North West posted the strongest result of any Hobart SA3 in June 2026. Its relative affordability compared with the inner city and southern suburbs appears to be drawing buyers who would otherwise face significantly higher entry prices elsewhere in the market.
- Sorell - Dodges Ferry: Ranked #2 with annual growth of +13.3 per cent and a median value of $713,491, this region to the south-east of the CBD continues to attract buyers seeking a coastal lifestyle within commuting range of central Hobart. The combination of relative value and lifestyle appeal has supported steady demand across the area.
- Hobart - South and West: Ranked #3 with annual growth of +10.8 per cent and a median value of $852,778, this is the priciest of Hobart's top three growth SA3s. Suburbs such as Blackmans Bay contribute to its appeal, offering established residential amenity and proximity to the waterfront corridor south of the city.
- Brighton and Hobart - North East: Ranks #4 and #5 cover contrasting parts of Greater Hobart. Brighton gained +10.4 per cent to a median of $641,786, with its position as one of the city's more affordable pockets supporting buyer interest from those priced out of more central locations. Hobart - North East posted +7.2 per cent annual growth and a median of $800,099, with suburbs such as Bellerive and Lindisfarne offering established east-bank character and easy access to the CBD.
- Hobart Inner: Ranked #6 with annual growth of +4.2 per cent and a median of $884,805, the inner city recorded more measured gains over the year. As the city's highest-value SA3, it faces the sharpest test from buyers' borrowing capacity, which may be tempering price momentum relative to the outer and coastal regions.
Thinking of selling or investing in Hobart? Compare local agents or get a free property report with OpenAgent.
View agent & property tools

Our powerful property tools

