OpenAgent Consumer Sentiment Report - 2023 Q3

Here at OpenAgent, we know the importance of up-to-date market insights. As Australia’s largest real estate comparison and referral platform, we speak to thousands of homeowners on the hunt for the right real estate agent to sell their home.
We’re in a unique position to capture the market perspectives of sellers, one of the most important groups in the real estate ecosystem. We hope you enjoy this report, and we look forward to delivering many unique insights in the quarters to come.
Sincerely yours, Zoe & Marta, Co-Founders of OpenAgent
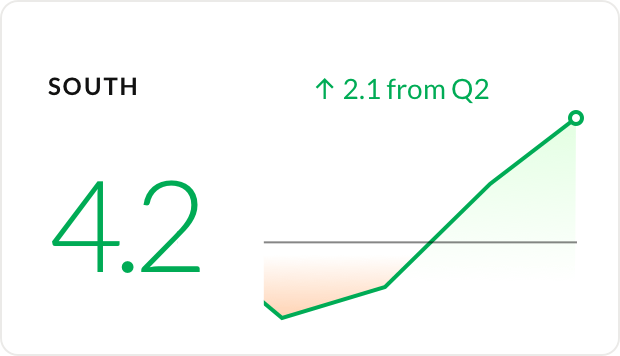
National consumer sentiment at a record high in July
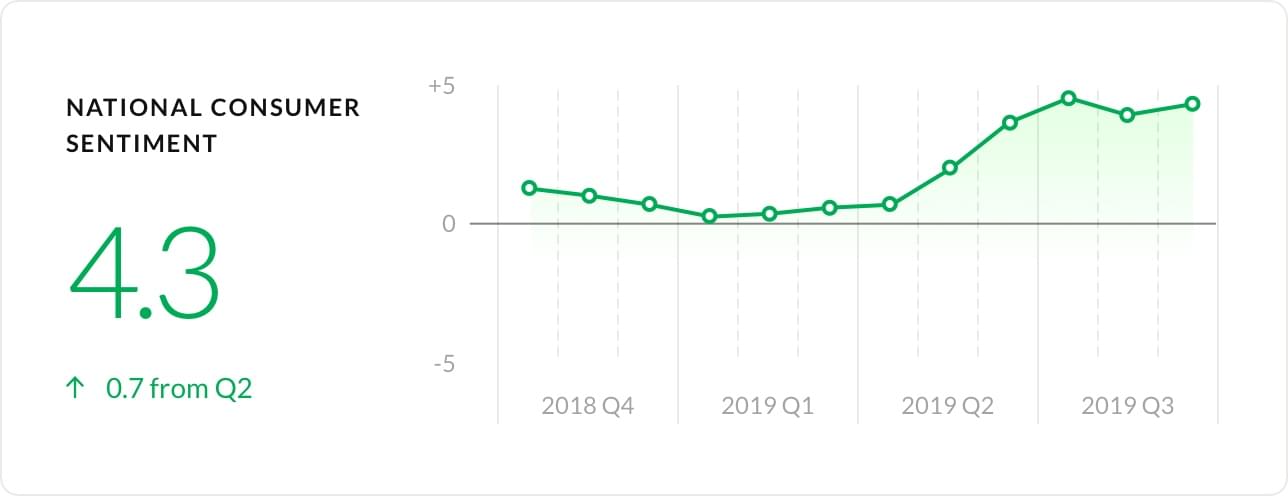
In Q3 2019, consumer sentiment continued to grow from an average of +2.1 in Q2 2019 to an average of +4.2. It moved from +3.6 in June to +4.5 in July. This is the highest value recorded in the history of the Consumer Sentiment Index. This represents 70% of vendors believing prices will go up within the next six months and only 6% believing prices will go down.
70% of vendors believe prices will go up within the next six months and only 6% believing prices will go down.
The drivers for this high level of optimism are potentially due to the high clearance rates in major cities as well as the interest rate cut that was announced. CoreLogic’s home value index also recorded the third consecutive month of gains for the nation. Consumer confidence has likely been boosted as dwelling values continue to climb.
State consumer sentiment mostly show strong growth
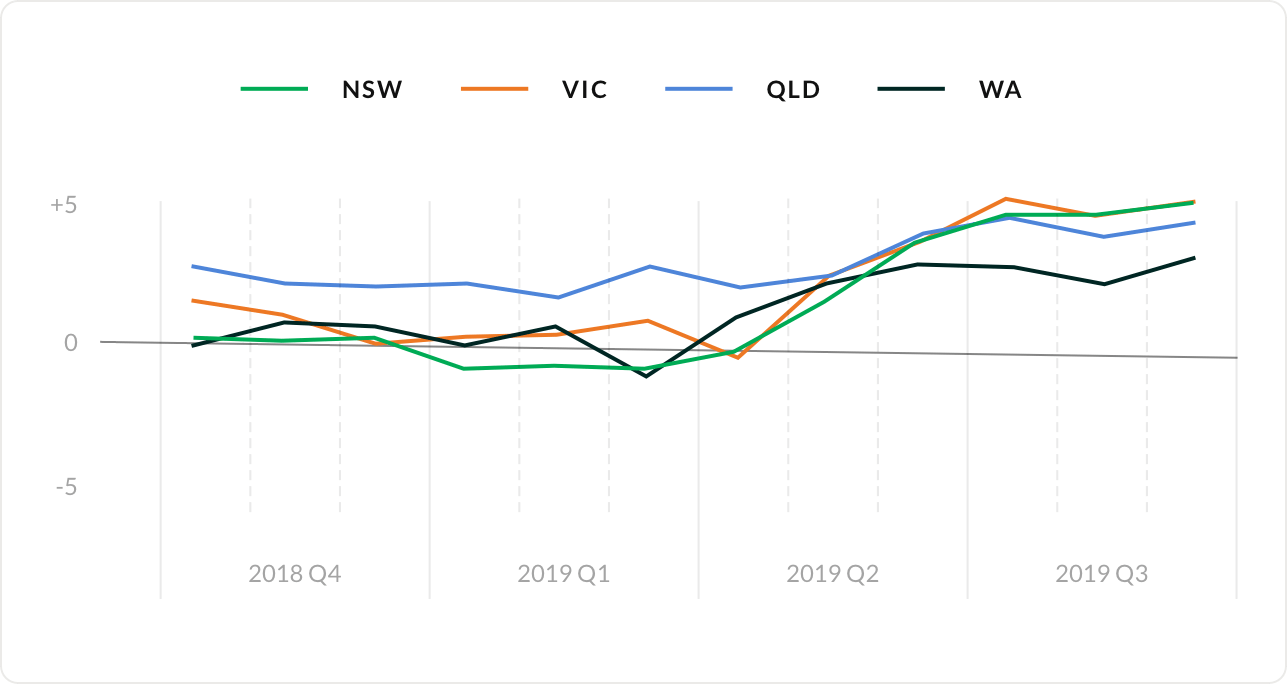
NSW sentiment highest since mid-2017
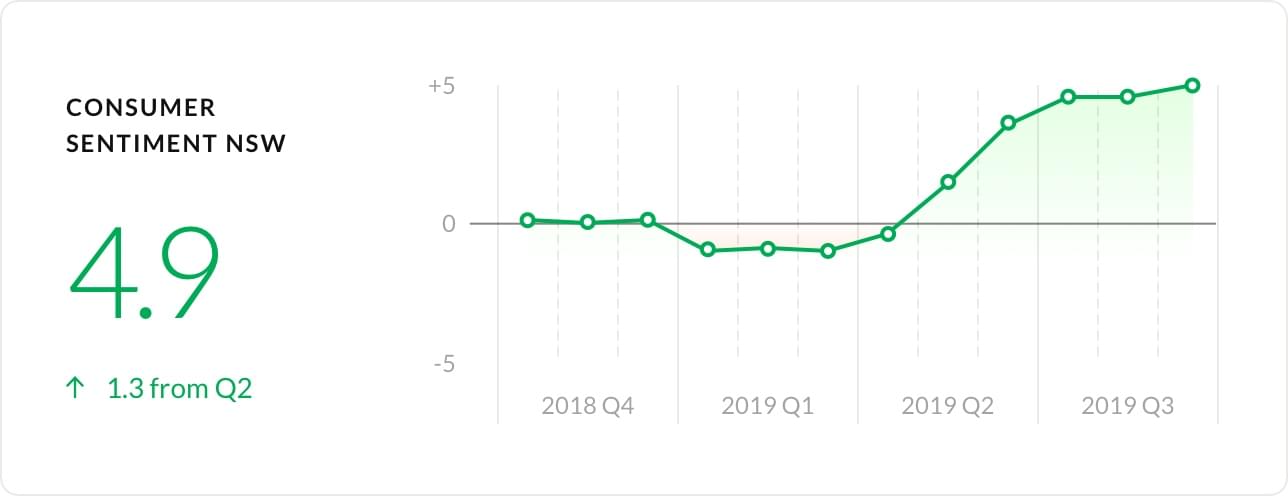
The consumer sentiment index in NSW increased from +3.5 in June to +4.9 in September, the highest it’s been since August 2017. In Q2 2017, the property market in NSW was relatively healthy. Hence, consumers are expecting the market to move in this direction. In June, only 58% of vendors in NSW believed prices were on the rise, whereas this has now increased to 74%.
In Q2 2019, we saw the NSW sentiment increasing as a result of factors such as Sydney showing its first positive increase in home value since July 2017. In Q3 2019, home values grew in NSW overall with a 1.6% increase in August followed by a 1.7% increase in September. The strong vendor expectations in NSW can likely be attributed to these signs of growth.
In Q3 2019, home values grew in NSW overall with a 1.6% increase in August followed by a 1.7% increase in September.
VIC sentiment is the highest compared to the other states
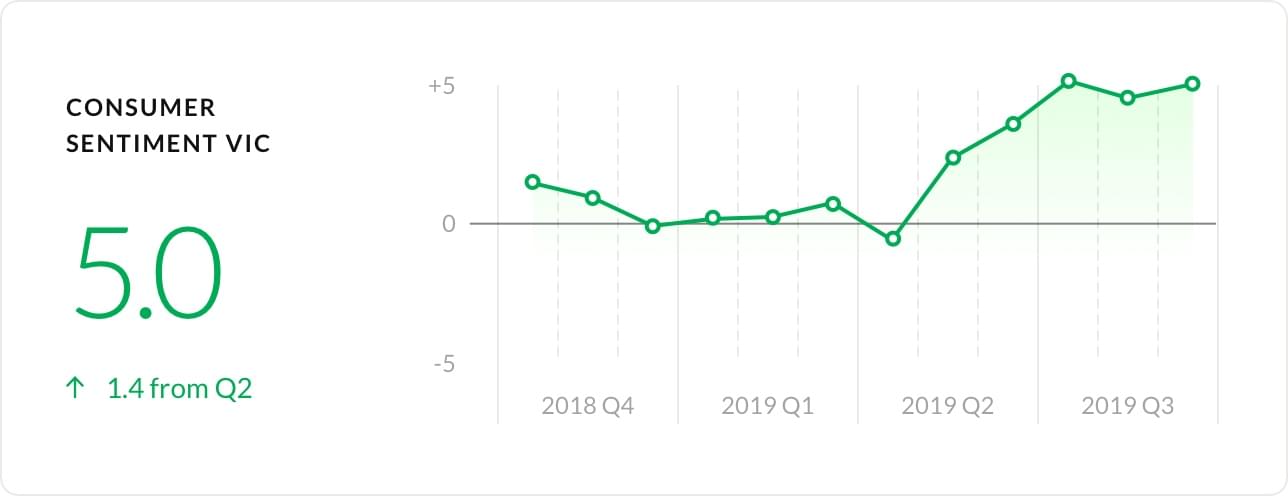
In June, 8.45% of Victorian home sellers were expecting prices to go down within the next six months. Now, the number has dropped to 5.4%. There are clearly high levels of confidence from sellers in the state, resulting in Victoria holding the highest consumer sentiment compared to other states for Q3 2019.
Consumer sentiment rose to +5.1 in July and fell in August to +4.5, before bouncing back to +5.0 in September. Similar to NSW, this is likely attributed to the cumulative 3.2% increase in house prices during August and September in Victoria. The strong housing demand in Melbourne has led many Victorian vendors to be more optimistic.
QLD sentiment remains steady compared to other states
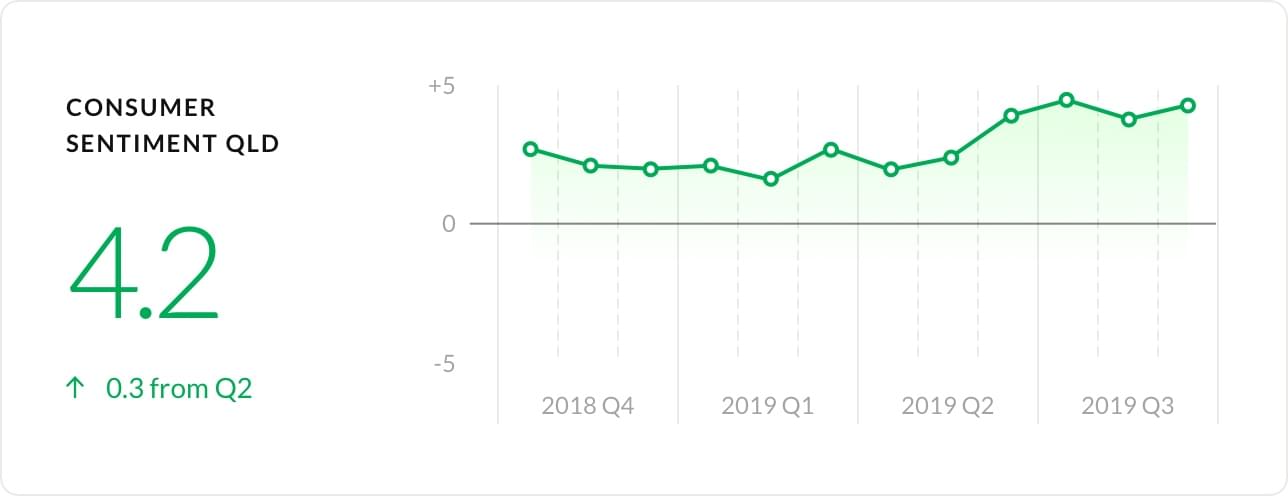
Even though the consumer sentiment in QLD hasn’t had the same dramatic jump that was seen in NSW and Victoria, the expectations still remain high. The index in September was +4.2, only about 0.4 points higher than it was in June. Though there has been some property growth in QLD, it has been relatively slow.
CoreLogic’s home value index showed a small 0.1% average month to month growth from July to September. This could explain why the sentiment in QLD hasn’t had as sharp of an increase. In September, about a third of QLD vendors believed that property prices will be staying the same for the next six months.
WA sentiment fluctuating in Q3 2019
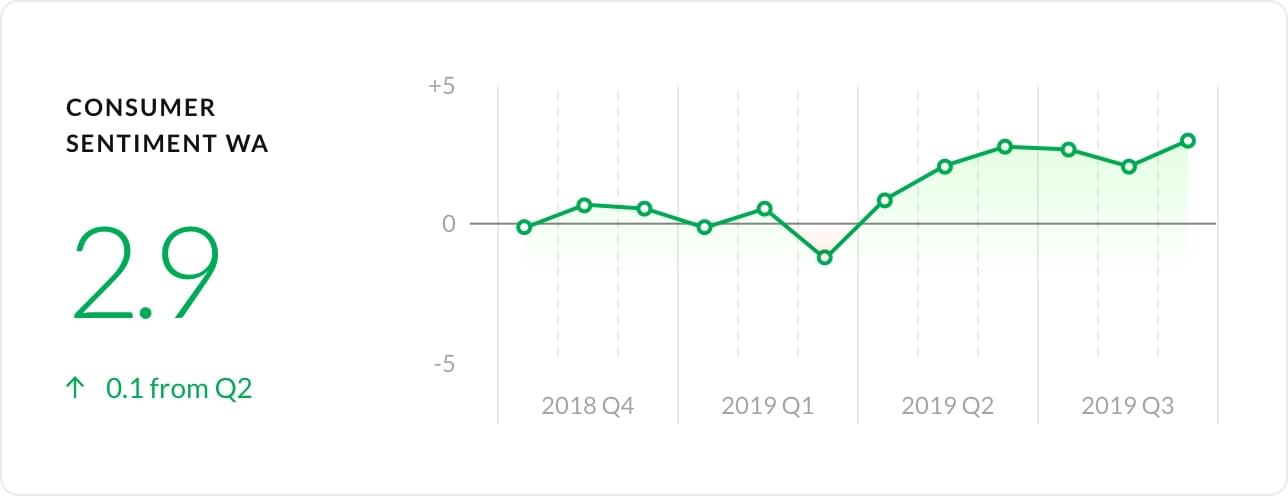
Unfortunately, the high levels of confidence seen in other areas of Australia can’t be seen in WA. Similarly to Q2 2019, consumer sentiment has been fluctuating a fair bit. From June to July, the index fell 0.2 points to +2.6 before falling another 0.6 points to +2.0 in August. In September, it did bounce back to +2.9. However, this level of optimism is still low.
Comparing the end of Q2 2019 to Q3 2019, the consumer sentiment only had a marginal increase of 0.1, +2.8 in June to +2.9 in September. Even after the election and interest rate cuts, Perth hasn’t seen many rebounds in property prices, likely contributing to the lack of confidence in WA.
Regional sentiment at an all time high
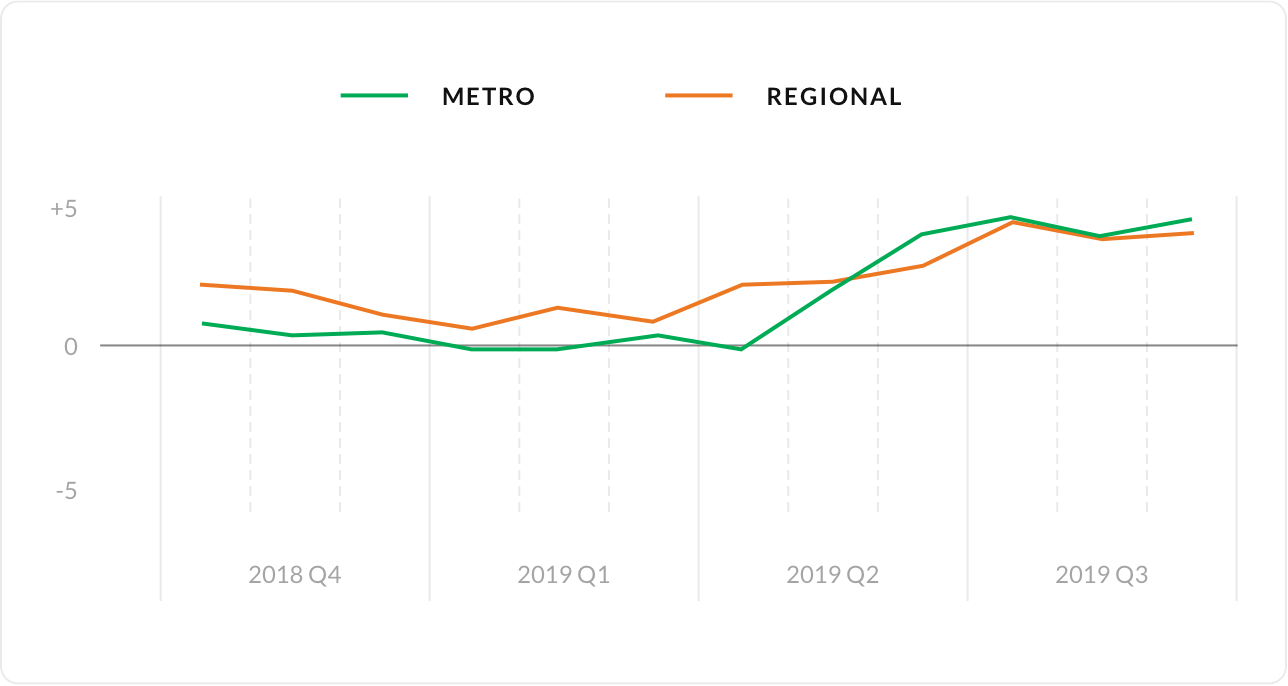
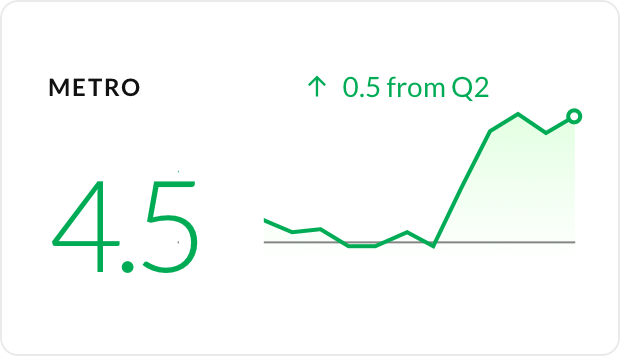
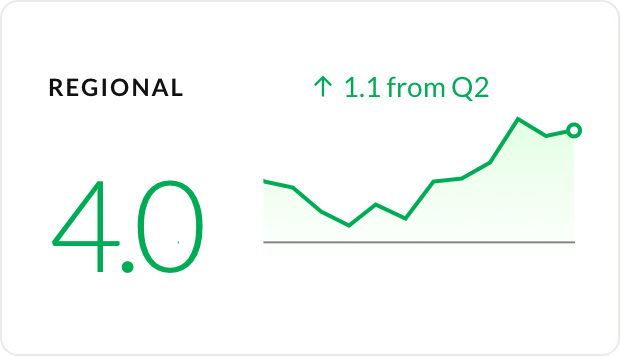
In Q3 2019, seller sentiment in regional areas recorded the highest index, +4.4 in July, since the beginning of the Consumer Sentiment Index. Despite this, vendors in metro areas still show a higher level of confidence. There have been three consecutive months where metro areas had a higher sentiment than regional areas. Before this, regional areas were outperforming metro areas since May 2018.
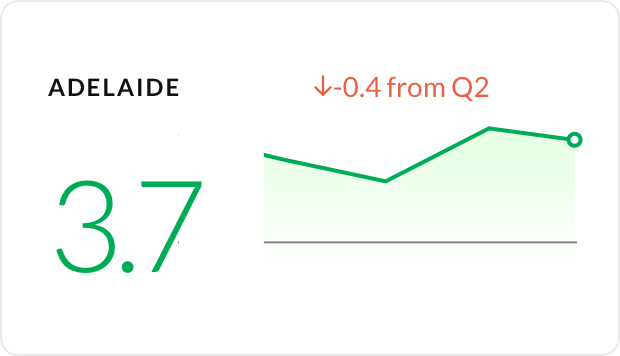
Capital city sentiment has continued to increase
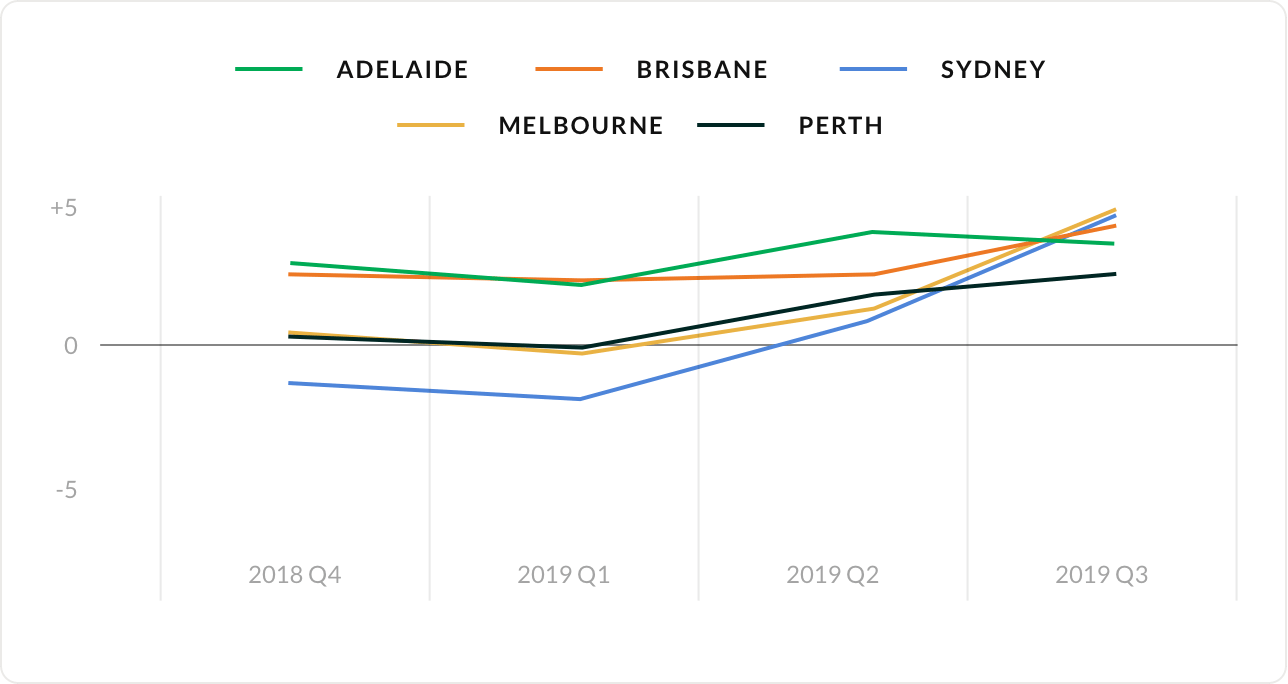
After the whopping increase in seller confidence across all capital cities in Australia, sentiment has continued to rise in most areas. Unfortunately, sentiment has dropped from Q2 2019 to Q3 2019 in Adelaide from +4.1 to +3.7. This is after Adelaide had the highest sentiment in Q2 2019.
After the whopping increase in seller confidence across all capital cities in Australia, sentiment has continued to rise in most areas.
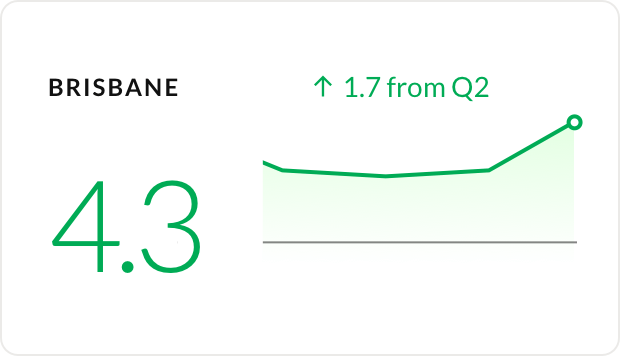

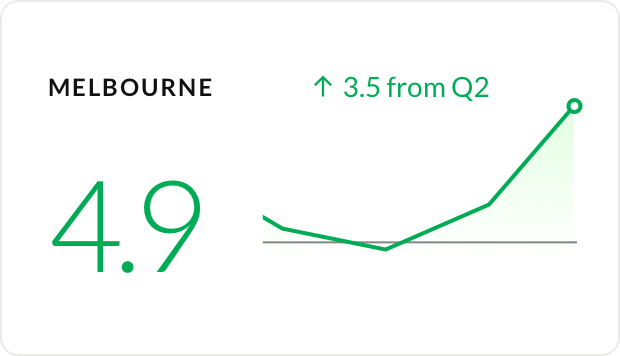

On the other hand, consumer sentiment in Melbourne and Sydney have increased dramatically. In Melbourne, the index went from +1.4 to +4.9 whereas in Sydney, it went from +0.9 to +4.6. Though the market in Perth hasn’t been performing extremely well compared to other capital cities, sentiment still had an increase of 0.8 points to +2.6 this quarter.
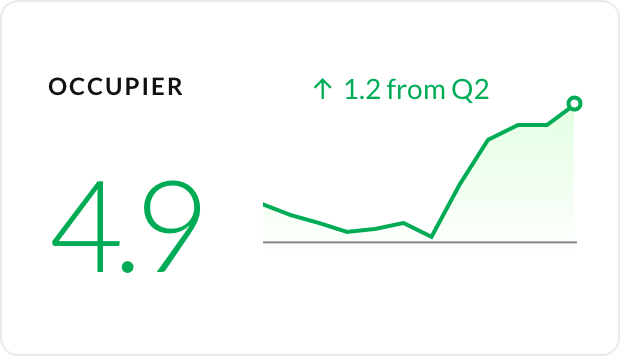
Investor and owner-occupier sentiment both on the rise
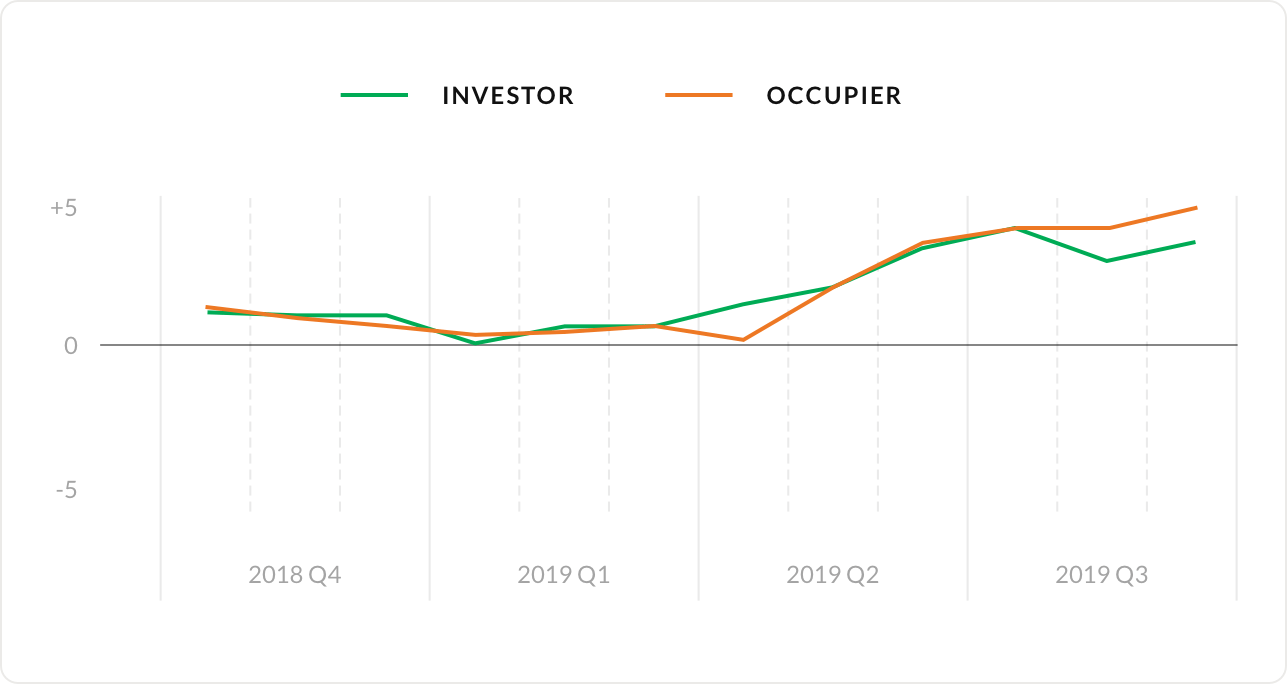
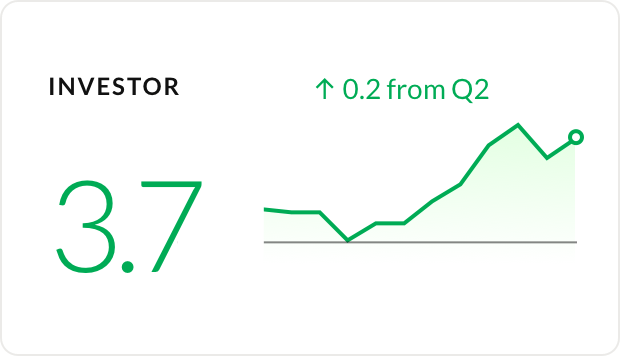
Despite investor sentiment recording an all-time low in the first quarter, it bounced back in Q2 2019 and has continued then upward trend into Q3 2019. From June to July, the index went up 0.7 points to +4.2. This is the highest it has been since 2017. Investor sentiment dropped to +3.0 in August before going back up to +3.7 in September.
Owner-occupier sellers are significantly more confident compared to six months ago. In March, sentiment was only +0.7 whereas in September, sentiment was recorded at +4.9. The average index for Q2 2019 was +2.0 compared to +4.6 in Q3 2019.
Highlight: Sydney regions all back to positive values


Our index takes a deeper look into Sydney, Greater Sydney and its surrounding regions of the Illawarra and the Central Coast/Newcastle.
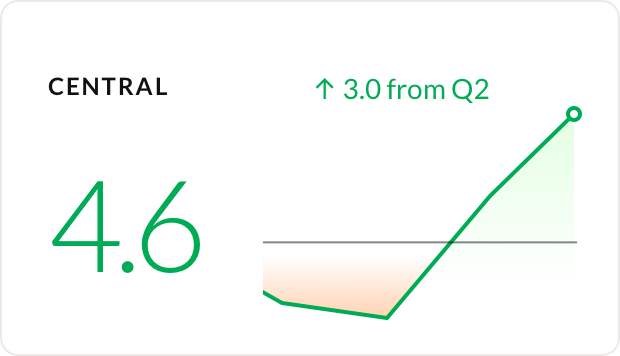
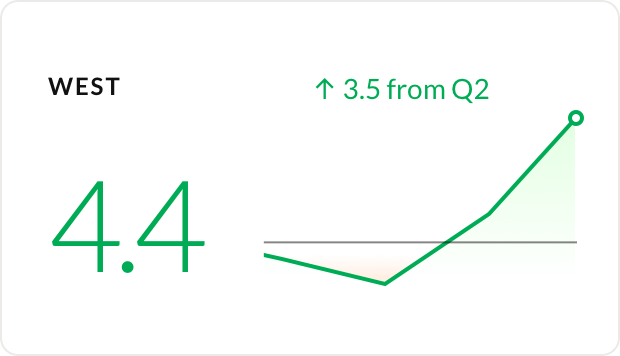
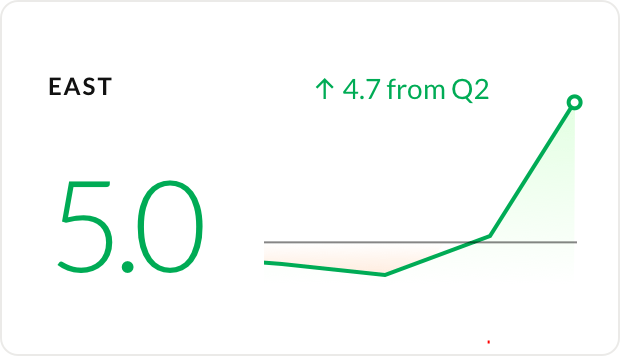
Seller confidence in all Sydney regions is high with index values above +4.0. North Sydney in particular has had a major turnaround going from a negative sentiment of -0.2 in Q2 2019 to an incredibly optimistic +5.0 in Q3 2019. Central, East, South and West Sydney have also seen an increase from quarter to quarter.
Seller confidence in all Sydney regions is high with index values above +4.0.
Regional areas of Sydney such as Illawarra and Newcastle have also yielded strong results. Sentiment in Illawarra has increased by 1.3 points from Q2 2019 to Q3 2019, now sitting on +4.6. Newcastle has seen a significant increase from +1.1 to +4.9. Tim Lawless, CoreLogic’s Head of Research, has said that many large regional centres including Illawarra and Newcastle are starting to recover.
How does the Consumer Sentiment Index work?
To build the Consumer Sentiment Index, we ask our vendors the following question:
Where do you expect home prices to be in your area in six months’ time?
Vendors then rank their answer on a 5 tier scale, ranging from Strongly Up, Slightly Up, About The Same, Slightly Down and Strongly Down.
"To build the Consumer Sentiment Index, we ask our vendors the following question: Where do you expect home prices to be in your area is six months' time?"
This information is then collated to provide the basis for our proprietary index system. The index gives a measure of vendors’ expectations for home price movement on a scale of -10 to +10, with a reading of 0 being a neutral view of the market.
Values above +5 indicate strong overall optimism and values below -5 indicate strong overall pessimism.
In 2019 Q3, we collected a total of 3,306 survey responses from OpenAgent customers all across Australia. All of our responses have been weighed against the relevant cohorts at the state level to remove any bias and present a realistic snapshot of sentiment for that group.
Using this methodology, we ensure that the Consumer Sentiment Index is relevant for all vendors, not just OpenAgent’s customers.
This regular report includes home price sentiment at a National, State and Metro level, as well as granular information about why people are selling, and what they see as the key factors driving their local markets.
In November 2016, we started compiling anonymised data that captures the sentiment and market expectations of consumers who are actively looking to sell their property.
April 2017 saw the inaugural release of the OpenAgent Consumer Sentiment Report, an ongoing quarterly publication that tracks market expectations of active vendors over time.
The latest instalment of this report, covering sentiment from July 2019 until the end of September 2019, shows some fascinating developing trends in sentiment across Australia, based on a total of over 42,189 responses across 35 months.