Australian property market update - December 2020

The latest CoreLogic Home Value Index reveals the Australian property market ended 2020 with continued growth, priming the market for a strong start in 2021.
All capital cities posted gains over the month, with Darwin surprisingly outperforming all other cities.
The largest markets of Sydney and Melbourne, continue to recover slowly as international borders remain closed.

National property values: December 2020
Houses
$596,090
Monthly change: +1.3%
Units
$525,688
Monthly change: +0.4%
Australian home values finished the year with a third consecutive month of month-on-month growth, rising +1.0 per cent in December.
Following a mild -2.1 per cent drop in home values between April and September, there was a quick recovery towards the tail-end of the year as property prices quickly bounced back.
CoreLogic research director, Tim Lawless, attributes the resilience of the Australian property market in 2020 to the substantial fiscal response from the Government.
“Record low interest rates played a key role in supporting housing market activity, along with a spectacular rise in consumer confidence as COVID-related restrictions were lifted and forecasts for economic conditions turned out to be overly pessimistic,” he said.
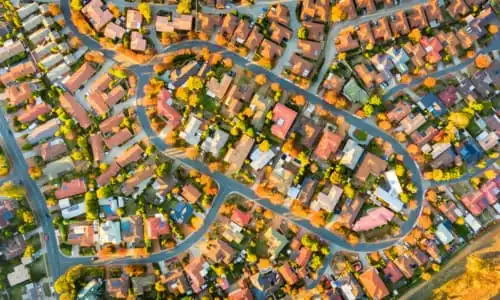
The latest figures show that regional markets continued to outperform capital cities.
Over the year, combined regional property prices rose by +6.9 per cent - more than three times higher than the combined capitals where values were up +2.0 per cent.
Mr Lawless explains that the continued prevalence of remote working and demand for lifestyle properties have caused regional areas with lower density housing to surge in popularity.
“Regional housing markets have generally underperformed relative to the capital city regions over the past decade, but 2020 saw regional housing values surge as demand outweighed supply,” he said.
The imbalance of demand and supply has been a common feature in the housing market throughout the year with the total number of properties on the market around -18 per cent lower compared to the same time last year.
According to Mr Lawless, current conditions of low stock levels coupled with high buyer demand means it is a good time for sellers.
“This imbalance between effective supply and demand is another factor that has supported a rise in housing prices as a sense of urgency returned to the market. With home buyers outnumbering sellers, most areas around the country represent a seller’s market,” he said.
The extent of buyer demand is reflected in auction activity. While previous years have seen the number of auctions reduce significantly in the lead up to Christmas, this year, buyers were still out in full swing.
So much so that the week ending Sunday 13th December marked the busiest week for auctions in capital city markets since early April with a total of 2,580 homes taken to market.
The average weighted clearance rate for all capital cities was an impressive 71.1 per cent - higher than the 69.9 per cent final clearance the week before for 2,085 auctions held.
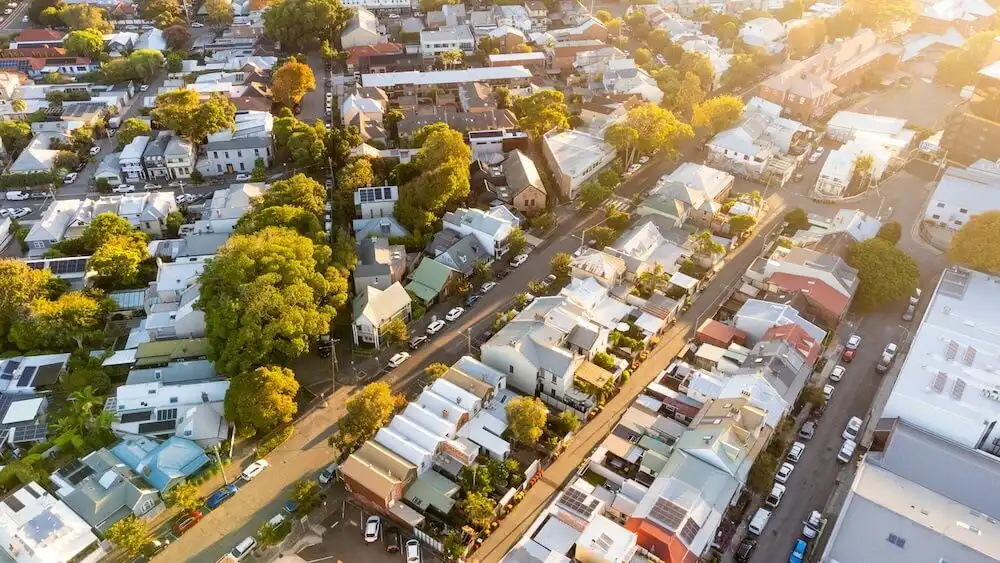
Sydney and regional NSW
Houses
$1,015,354
Monthly change: +1.1%
Units
$733,852
Monthly change: -0.1%
Over the month, Sydney property prices continued to grow, reporting a +0.7 per cent increase to a median value of $871,749.
Sydney houses performed significantly better than units, rising +1.1 per cent compared to the drop of -0.1 per cent for units.
The decline in Sydney unit prices is expected to continue as international borders remain closed.
The auction market remains strong with the week ending Sunday 13th of December reporting a final auction clearance rate of 73.1 per cent. This is the 8th consecutive week the city has recorded a clearance rate of over 70 per cent.
Sydney’s most expensive segment of the market is also picking up, recording a +0.7 per cent rise in values in December compared to a +0.6 per cent increase across the most affordable market.
The CoreLogic Best of the Best Report for 2020 also highlights the resilience of the luxury property market, with the latest data revealing that most expensive properties in the country are from the eastern suburbs of Sydney.
According to the report, the most expensive suburb to purchase a house in Australia is in Sydney’s Darling Point which has a median value of $7.06m.
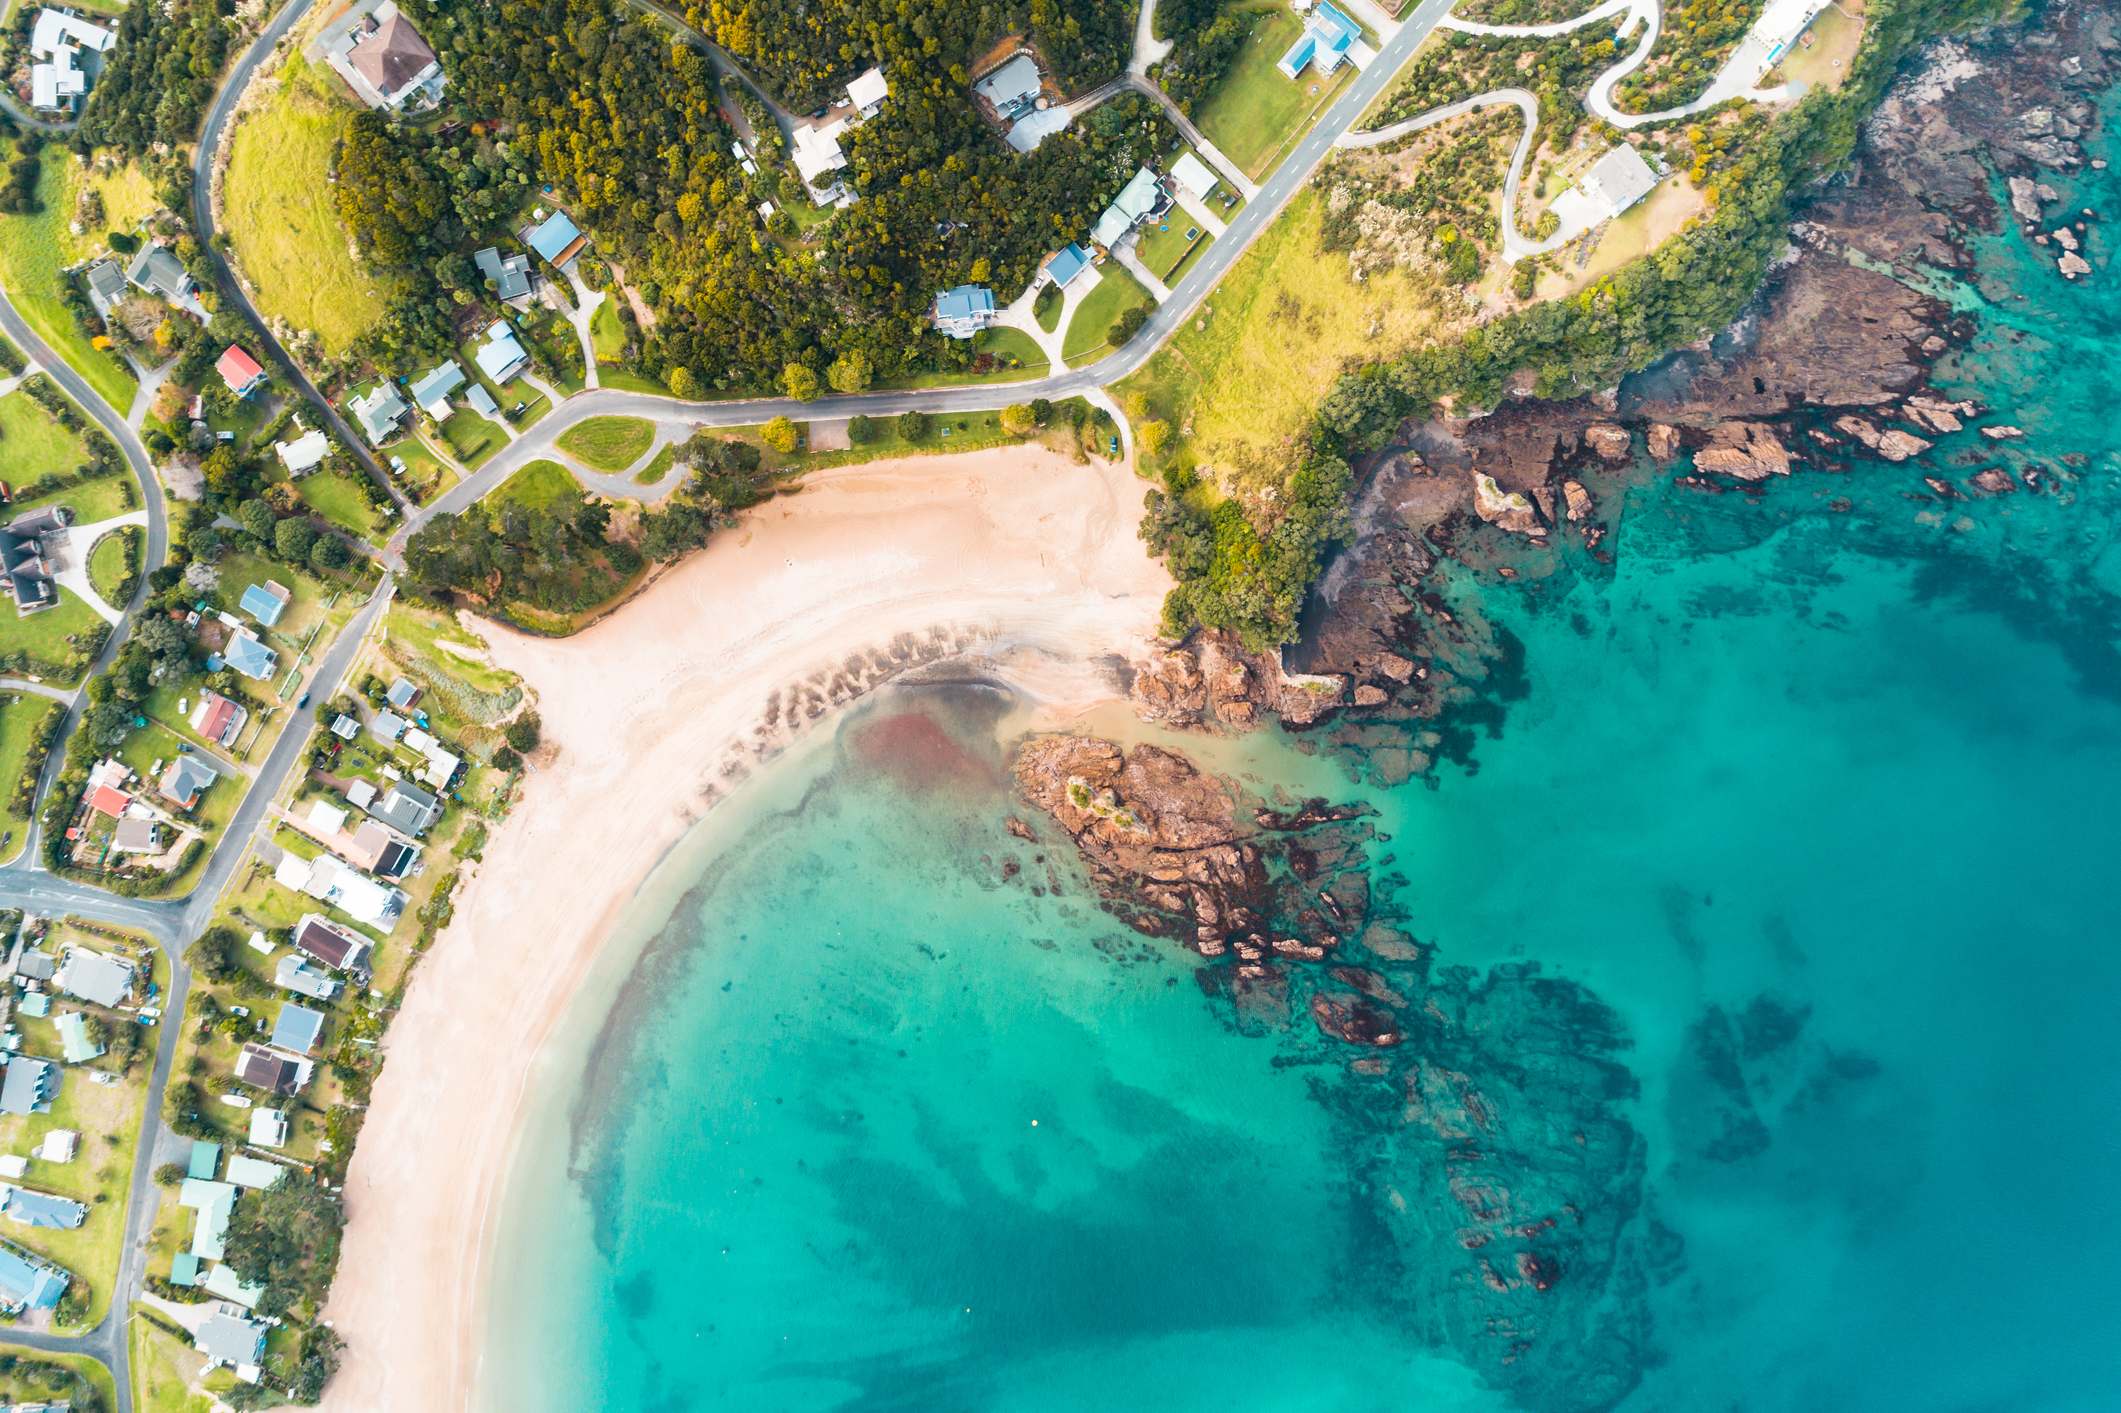
Regional NSW property prices
Houses
$521,519
Monthly change: +1.8%
Units
$425,135
Monthly change: +1.2%
Regional NSW properties outperformed those in Sydney over December with growth of +1.7 per cent. The median price for a property in regional NSW now sits at $503,744.
The value of regional NSW properties is up +8.3 per cent higher compared to the same time last year.
Regional houses performed better than units over the month, up +1.8 per cent compared to the +1.2 per cent increase for units.
This is most likely due to the fact that lower density properties with more space have been in higher demand.
The CoreLogic Best of the Best Report reveals that the suburb in NSW with the greatest increase in value over the year is Bombala, in the Monaro region, with an impressive rise of +22.6 per cent.
Melbourne and regional VIC
Houses
$799,980
Monthly change: +1.2%
Units
$576,905
Monthly change: +0.6%
Melbourne properties prices continue their recovery, reporting a +1.0 per cent increase in value to a median of $682,197.
Both houses and units posted growth over December, with house values jumping +1.2 per cent while units rose by +0.6 per cent.
The most expensive segment of the market which lost the most value throughout the pandemic is now rebounding the fastest.
Melbourne’s most expensive quartile increased in value by +0.98 per cent in December compared with a mildly lower +0.97 per cent rise across the more affordable quartile.
Auction activity also increased in the lead up to Christmas with 1167 auctions held across the country in the week ending Sunday 13th December. This accounted for just over half of all scheduled auction activity in the country.
The final auction clearance rate of 69.7 per cent was extremely successful, an improvement from the 67.7 per cent rate the week previous with only 899 auctions.
Taking a look at CoreLogic’s Best of the Best report, the most expensive suburb to purchase a house in Victoria for 2020 is revealed to be Toorak in Inner Melbourne, with a median price of $4m.
Regional VIC property prices
Houses
$443,586
Monthly change: +1.8%
Units
$307,791
Monthly change: +1.7%
Growth for regional Victorian houses and units was quite strong over the month with houses increasing +1.8 per cent and units following closely behind with growth of +1.7 per cent.
Annually, regional Victorian properties are +5.6 per cent higher than they were the last time last year.
The CoreLogic Best of the Best Report reveals that the suburb in Victoria with the greatest increase in value over 2020 is Murtoa, located in the Yarriambiack Shire, jumping +22.4 per cent.
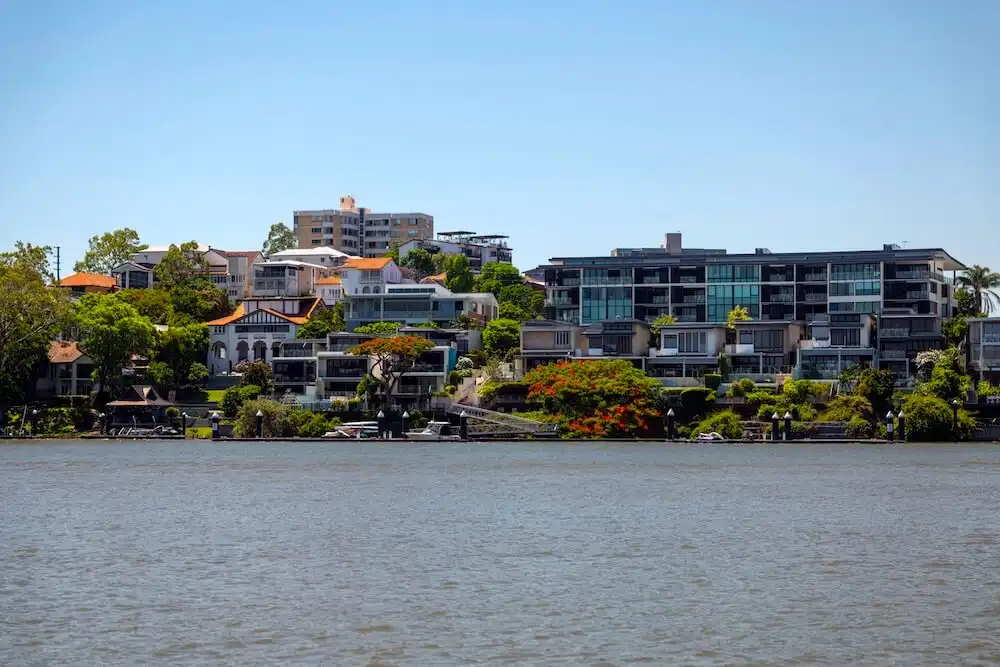
Brisbane and regional QLD
Houses
$576,338
Monthly change: +1.2%
Units
$390,785
Monthly change: +0.4%
Brisbane property values were up +1.1 per cent over the month, with the median value of a property sitting at $521,686.
Brisbane houses performed better than units with a leap of +1.2 per cent compared to +0.6 per cent for units.
Brisbane is showing strength across its most expensive market with values up +1.25 per cent over the month compared with a +0.94 per cent across the most affordable market.
The strong growth in the upper quartile of the market is an indicator that the market is once again gaining momentum.
Looking at Brisbane’s best performers for 2020, the CoreLogic Best of the Best report shows us that the suburb with the most expensive houses is Teneriffe in inner-Brisbane, recording a median value of $1.8m.
Regional QLD property prices
Houses
$417,877
Monthly change: +1.5%
Units
$375,076
Monthly change: +1.0%
Regional Queensland property prices also performed well over the month, rising +1.4 per cent over the month to $405,763.
Houses and units had similar growth, with houses up by +1.8 per cent and units by +1.7 per cent.
Looking at values year-on-year, regional Queensland properties are +6.9 per cent higher than they were in 2019.
The CoreLogic Best of the Best Report reveals that the suburb in Queensland with the greatest increase in value over the year is Sunshine Beach in Noosa, climbing an incredible +27.6 per cent.
Hobart and regional TAS
Houses
$551,462
Monthly change: +0.9%
Units
$417,724
Monthly change: -0.3%
Over the month, Hobart property values increased by +0.7 per cent to a median of $513,552.
Annually, Hobart properties have performed quite well and are +6.1 per cent higher than they were compared to the same time last year.
Breaking down house and unit performance, houses performed significantly better with a hike of +0.9 per cent. Hobart units on the other hand fell into the negatives, dropping -0.3 per cent.
According to the CoreLogic Best of the Best Report, the most expensive suburb in Tasmania to purchase a house was Battery Point in Hobart, where houses have a median value of $1.1m.
Regional TAS property prices
Houses
$359,521
Monthly change: +2.5%
Units
$271,076
Monthly change: -0.9%
Regional Tasmanian properties were a top performer over the month, skyrocketing +2.1 per cent.
This stellar performance can be primarily attributed to regional Tasmanian houses in particular, which saw a +2.5 per cent increase.
Units on the other hand fell -0.9 per cent - the weakest monthly performance of all the regional areas.
The CoreLogic Best of the Best Report reveals that the suburb in Tasmania with the greatest increase in value for houses over the year is Rosebery on the state’s west coast, where values are up +27.3 per cent.
Canberra and the ACT
Houses
$762,608
Monthly change: +0.7%
Units
$467,977
Monthly change: +0.3%
Canberra properties continue on an upward trend, rising +0.6 per cent over December.
Canberra houses performed better than other dwellings, up +0.7 per cent compared to +0.3 per cent for units.
Annually, Canberra properties are +7.5 per cent higher than they were the same time last year - one of the highest around the country.
Taking a look at auction activity, Canberra has been the standout performer over the second half of 2020, consistently achieving clearance rates between the 70-90 per cent range.
The CoreLogic Best of the Best Report reveals the most expensive suburb in the ACT to purchase a house in 2020 was the Canberra suburb of Forrest, where the median value is $3.1m.
Adelaide and regional SA
Houses
$504,829
Monthly change: +1.2%
Units
$344,493
Monthly change: +0.5%
Over the month, Adelaide properties climbed +1.1 per cent to a median of $468,544.
Similar to other capital cities, houses performed better than units with a rise of +1.2 per cent for houses compared to an increase of half a per cent for units.
In the longer term, Adelaide property prices are doing quite well, up +3.6 per cent over the past three months and +5.9 per cent over the year.
According to the CoreLogic Best of the Best Report, the most expensive suburb in South Australia to purchase a house in over the year was in Adelaide’s Unley Park, where the median value is $1.3m.
Regional SA property prices
Houses
$258,042
Monthly change: +2.1%
Units
$194,084
Monthly change: +0.6%
Regional South Australia performed really well over the month, rising +2.0 per cent.
Breaking down performance of houses and units, houses definitely had stronger growth than units, up +2.1 per cent compared to +0.6 per cent for units.
Annually, properties in regional South Australia are +8.1 per cent higher than they were the same time last year.
The CoreLogic Best of the Best Report reveals that the suburb in South Australia with the greatest increase in value for houses over the year is the state’s southernmost town of Port Macdonnell, up +23.4 per cent.
Perth and regional WA
Houses
$490,810
Monthly change: +1.1%
Units
$365,037
Monthly change: +1.1%
Over the month, Perth property prices increased by +1.1 per cent to a median of $471,310.
Perth is one of the few capital cities where houses did not outperform units. House and unit growth over the month are the same at +1.1 per cent.
According to the CoreLogic Best of the Best Report, the most expensive suburb in Perth to purchase a house in over the year was in Peppermint Grove, where the median value is $2.4m.
Regional WA property prices
Houses
$343,619
Monthly change: +1.2%
Units
$217,801
Monthly change: 0.0%
In regional Western Australia, property prices performed slightly better than in Perth, climbing +1.2 per cent to a median of $330,684.
Houses rose +1.2 per cent while unit growth remained unchanged.
The CoreLogic Best of the Best Report reveals that the suburb in Western Australia with the greatest increase in value for houses over the year is Wannanup, just south of Mandurah, up +17.2 per cent.
Darwin and regional NT
Houses
$497,222
Monthly change: +2.3%
Units
$290,774
Monthly change: +2.3%
Darwin has been a top performer over December with property prices increasing an incredible +2.3 per cent to a median of $416,183.
Both houses and units performed equally as strong, leaping +2.3 per cent.
Annually, property prices in Darwin are +9.0 per cent higher than they were the same time last year. This is the highest of all the capital cities.
While this is surprising, SQM Managing Director Louis Christopher said in an interview with industry expert Tom Panos on the 13th of December that market conditions have changed in Darwin especially in the rental market.
“Darwin is also a market that has really turned around, which I gotta say we’ve been scratching our heads on because before coronavirus the Darwin economy was very soft, there was not much short-to-mid-term prospects for the local economy there.
“And then all of a sudden around April we noticed rental vacancy rates in Darwin started plummeting and the word on the ground we heard was that there were a lot of Victorians moving to the Northern Territory all of a sudden.
“I think one of the things that is going to come up is that there has been a bit of a mass interstate exodus of Victorians trying to get away from the state due to all the lockdowns and Darwin has been one of the places they’ve been able to go to because Darwin was the first territory to open up its borders,” he said.
According to the CoreLogic Best of the Best Report, the most expensive suburb in the Northern Territory to purchase a house in over the year was Lyons in Darwin, where the median value is $720,580.
Regional NT property prices
Houses
$434,182
Monthly change: +2.8%
Units
$ n/a
Monthly change: n/a
Regional Northern Territory properties are also a top performer, jumping +2.8 per cent over the month to $434,182.
Rental market update

Rental conditions have varied greatly between states.
Perth and Darwin have had the highest annual change in rents with both cities up around +10 per cent for house rents and unit rents up +6.8 per cent for Perth and +7.6 per cent in Darwin.
Mr Lawless says the strength in rental conditions is due to strong demand and minimal supply.
“Both Perth and Darwin have recorded below average levels of investor activity since housing market conditions started to cool in mid-2014 which has led to a shortage of rental shock.
“More recently with stronger interstate migration driving housing demand, rental rates have been under substantial upwards pressure as demand for rentals outweighs supply,” he said.
In the nation’s biggest markets of Melbourne and Sydney, rental conditions are quite different as low demand and high supply has caused a significant drop in rents.
Mr Lawless attributes stalled overseas migration as the primary factor for this decline, especially in the unit sector.
“Weak demand for inner city unit rentals has been exacerbated by a recent history of high rise apartment construction in Melbourne and Sydney, with the pipeline of new units that are still under construction remaining well above the decade average.
“Melbourne unit rents are down -7.6 per cent over the calendar year and Sydney unit rents are down -5.7 per cent.
“Weak rental conditions across the unit sector are likely to persist until overseas migration starts to ramp up and the higher levels of supply are absorbed,” he said.
Across the capital cities, gross rental yields are the highest in Darwin at +6.0 per cent and lowest in Sydney at +2.9 per cent.
In our non-capital city areas, regional NT leads with +6.7 per cent while regional VIC reported the lowest yield at +4.3 per cent.
What does this mean for the Australian property market? What is the outlook for the months ahead?
While the number of property sales dropped by -40 per cent through March and April, annual home sales actually ended the year around +8 per cent higher than a year ago due to a surge in buyer numbers in the second half of the year.
Risks related to less fiscal support and expiry of mortgage repayment deferrals have diminished as the economy outperforms forecasts and labour markets recover lost jobs.
The latest ABS unemployment figures show an improvement in employment levels as the unemployment rate decreased -0.2 percentage points to 6.8 per cent in November.
According to APRA, home loan deferrals dropped to 3.9 per cent of the loan book in October, down from the 11 per cent in June which signals that the expiry of mortgage repayment holidays in March will less likely cause a significant rise in distressed homes coming onto the market.
With consumer sentiment soaring, property prices continuing to rise, GDP rising +3.3 per cent in the September quarter and the Covid-19 vaccine set to roll out in the first half of 2021, industry experts and economists are forecasting positive growth for the Australian property market in 2021.
Although the trajectory of the property market is looking up, Mr Lawless does warn that some risks still remain for the economy and housing market such as potential outbreaks in the future causing further restrictions and continued closure of international borders.