Australia's top growth suburbs since the pandemic

It’s easy to get caught up in the short-term noise of the property market, with interest rate jitters and monthly price shifts often dominating the headlines.
However, as any seasoned owner will tell you, real estate is a long-term game, and the last six years have provided a powerful reminder of just how much equity can be built over time.
We've tracked the top-performing growth suburbs in every capital city and regional area between January 2020 and December 2025. Here are the locations that have defined the pandemic-era boom.

Get a free property value estimate
Find out how much your property is worth in today’s market.
Sydney and New South Wales
Sydney's property market has seen some huge changes since 2020, mostly driven by a massive shift toward the city’s outer edges and growth corridors.
While interest rates and affordability have been big talking points in recent years, the massive capital gains seen across the city over the last six years show just how resilient the market has been.
Sydney's top growth suburbs since January 2020
Suburb Region Property type Median price (Dec 2025) 6-year growth Menangle Park MacArthur/Camden House $1,223,700 207% Melonba Western Sydney House $1,270,000 183% Colebee Western Sydney House $1,380,000 183% Box Hill Western Sydney House $1,300,000 160% Austral Liverpool / Fairfield House $1,088,000 154% Leppington Liverpool / Fairfield House $1,170,000 154% Gables Hills House $1,365,000 133% Cobbitty MacArthur/Camden House $1,200,000 129% Waverton North Shore - Lower House $4,865,000 112% Edgecliff Eastern Suburbs House $4,525,000 107% Western Sydney and the Outer South West have been the clear standouts, with house values in suburbs like Menangle Park more than tripling and Melonba nearly tripling since early 2020.
The list is almost entirely made up of houses, which shows how much people prioritised land and space over the course of the pandemic. Even premium inner-city pockets like Waverton and Edgecliff saw values more than double, rewarding long-term owners with some incredible equity.
Growth in regional NSW was even more explosive over the same period as tree changers and investors started looking toward inland hubs and coastal stretches.
Regional NSW's top growth suburbs since January 2020
Suburb Region Property type Median price (Dec 2025) 6-year growth Caerleon Dubbo & Orana House $725,000 304% Lochinvar Hunter Valley - Lower House $885,000 302% Crangan Bay Hunter Valley - Lower House $980,000 214% Crackenback Capital Monaro & Snowy House $1,260,000 209% Wyee Hunter Valley - Lower House $1,000,000 203% Dunedoo Dubbo & Orana House $432,000 174% North Rothbury Hunter Valley - Upper House $825,000 173% Catherine Hill Bay Lake Macquarie East House $1,380,000 167% Casuarina Northern Rivers Apartment $1,200,000 164% Ungarie Riverina House $169,900 161% Some of the most incredible results came out of the Dubbo and Orana region, where house values in Caerleon more than quadrupled, followed closely by Lochinvar in the Lower Hunter Valley which also more than quadrupled.
The Hunter Valley was a massive standout, claiming three of the top five spots as buyers looked for a mix of lifestyle and access to major employment hubs.
From the snowy peaks of Crackenback to the beachside appeal of Casuarina apartments, the data shows that these massive gains were spread right across the state’s diverse regional landscape.
Note: Data is taken from Domain (January 2020 to December 2025). Suburbs are only included if Domain recorded sufficient sales (10+ sales) to calculate medians for both time periods.
 - https://sketch.com --%3e %3ctitle%3eicons / icon-chevron-down%3c/title%3e %3cdesc%3eCreated with Sketch.%3c/desc%3e %3cg id='icons-/-icon-chevron-down' stroke='none' stroke-width='1' fill='none' fill-rule='evenodd'%3e %3crect id='Icon-container' x='0' y='0' width='24' height='24'%3e%3c/rect%3e %3cpolygon id='Shape' fill='%2300AB55' points='12 14.3357864 5.20710678 7.54289322 3.79289322 8.95710678 12 17.1642136 20.2071068 8.95710678 18.7928932 7.54289322'%3e%3c/polygon%3e %3c/g%3e%3c/svg%3e)
Melbourne and Victoria
The Melbourne property market has moved at a slightly different pace since the start of 2020 compared to most capitals.
While land taxes and a steady flow of listings have influenced the broader city, specific pockets in the outer rings have still delivered some really impressive results for homeowners.
Melbourne's top growth suburbs since January 2020
Suburb Region Property type Median price (Dec 2025) 6-year growth Pakenham Upper South East House $1,600,000 63% Officer South South East House $890,000 62% Avonsleigh Yarra-dandenong Ranges House $990,000 59% Yarrambat North House $2,386,250 54% Frankston North Bayside House $682,500 52% Lower Plenty North House $1,390,000 50% The Patch Yarra-dandenong Ranges House $1,130,000 49% Gowanbrae North House $899,000 44% Beaconsfield Upper South East House $1,508,000 43% Junction Village Phillip Island & District House $699,975 41% Suburbs in the South East were the standout performers, with house values in Pakenham Upper and Officer South both jumping by more than 60 per cent since the onset of the pandemic.
The top ten list is made up entirely of houses, with growth concentrated in green, outer-fringe areas like Yarrambat and the Yarra-Dandenong Ranges.
Regional Victoria actually outpaced the capital over the same period, particularly in the state's north west where several small towns saw values soar.
Regional VIC's top growth suburbs since January 2020
Suburb Region Property type Median price (Dec 2025) 6-year growth Pyramid Hill North Western House $317,500 170% Charlton North Western House $340,000 152% Rainbow North Western House $205,000 146% Rupanyup North Western House $213,500 137% Minyip North Western House $168,500 125% Ouyen North Western House $257,500 124% Sea Lake North Western House $232,500 121% Nyah West North Western House $286,250 120% Koondrook North Western House $510,000 117% Donald North Western House $315,000 117% The North Western region saw some truly spectacular gains, with house values in Pyramid Hill nearly tripling and Charlton more than doubling since 2020.
This inland lifestyle trend was evident across the entire list, with every single top-performing suburb located in the state's North Western corridor.
Smaller townships like Rainbow and Rupanyup also featured heavily, proving that the pandemic-era shift toward affordable, regional living has had a massive and lasting impact on the state.
Note: Data is taken from Domain (January 2020 to December 2025). Suburbs are only included if Domain recorded sufficient sales (10+ sales) to calculate medians for both time periods.
Brisbane and Queensland
Brisbane has been one of the biggest winners of the last six years, fuelled by a relentless wave of interstate migration and a search for better value.
The city’s market has essentially been on a non-stop tear since 2020, with many of its more affordable corridors seeing prices climb to levels that few would have predicted before the pandemic.
Brisbane's top growth suburbs since January 2020
Suburb Region Property type Median price (Dec 2025) 6-year growth Woodridge Logan Apartment $450,000 181% Beenleigh Logan Apartment $520,000 162% Ellen Grove Southside House $690,000 160% Lawnton City & North Apartment $625,000 158% Browns Plains Logan House $845,500 152% Kingston Logan House $737,000 150% Eagleby Logan Apartment $523,000 149% Park Ridge South Logan House $1,465,000 148% Logan Central Logan Apartment $431,510 145% Newport Redcliffe / Bribie / Caboolture House $1,500,000 139% The Logan region has been a massive powerhouse for growth, with suburbs like Logan Central, Beenleigh, and Eagleby all seeing values more than double over the last six years.
Interestingly, the top three spots are actually held by the unit market, showing that buyers have been looking for any available entry point into these high-demand areas. This trend of rapid growth in more affordable pockets is also seen in house values across Kingston and Brendale, which have both comfortably more than doubled since the start of 2020.
Regional Queensland saw just as much action over the same period, with the lifestyle shift pushing values in coastal and island communities to new heights.
Regional QLD's top growth suburbs since January 2020
Suburb Region Property type Median price (Dec 2025) 6-year growth Nelly Bay Townsville & District Apartment $550,000 224% Booval Ipswich & West Moreton Apartment $535,000 224% Wandoan South House $242,500 223% Miles South Apartment $305,000 221% Barney Point Gladstone Rockhampton & Capricornia House $450,000 200% Kooralbyn South Apartment $320,000 196% Lowood Ipswich & West Moreton House $685,000 191% Hyde Park Townsville & District Apartment $349,000 191% Leichhardt Ipswich & West Moreton House $680,000 184% Riverview Ipswich & West Moreton House $680,000 182% Mount Morgan claimed the top spot in the regions with house values more than doubling, followed closely by the southern Moreton Bay islands of Russell Island and Macleay Island.
These island communities became major hotspots for buyers looking to escape the city, with prices in both locations more than doubling as the work-from-home trend took off.
The list also shows strong growth in more traditional regional hubs like Maryborough and Gin Gin, proving that the pandemic-era boom reached well into the state’s heartland and wasn't just limited to the coastline.
Note: Data is taken from Domain (January 2020 to December 2025). Suburbs are only included if Domain recorded sufficient sales (10+ sales) to calculate medians for both time periods.
Adelaide and South Australia
Adelaide has remained one of Australia's most consistent and resilient performers since the start of 2020.
While other capitals have seen more volatility, the South Australian capital has seen a steady and relentless climb in values, largely driven by its relative affordability and a persistent shortage of available homes.
Adelaide's top growth suburbs since January 2020
Suburb Region Property type Median price (Dec 2025) 6-year growth Davoren Park North & North East Suburbs House $561,000 230% Elizabeth South North & North East Suburbs House $551,000 228% Munno Para West North & North East Suburbs House $655,000 210% Elizabeth East North & North East Suburbs House $630,000 206% Elizabeth Downs North & North East Suburbs House $585,000 193% Croydon Park Western & Beachside Suburbs House $935,000 188% Elizabeth Park North & North East Suburbs House $605,000 184% Elizabeth North North & North East Suburbs House $496,000 183% Smithfield Plains North & North East Suburbs House $570,500 172% Elizabeth Vale North & North East Suburbs House $653,500 171% The northern and north-eastern suburbs have been the absolute powerhouses for growth, with house values in Davoren Park and Elizabeth South more than tripling since early 2020.
This list is dominated entirely by houses in these affordable northern pockets, where suburbs like Munno Para West and Elizabeth East have also seen prices more than triple. This trend shows that buyers have been flooding into these historically undervalued areas, pushing prices up at a rate that has outpaced almost everywhere else in the country.
Regional South Australia has also seen some incredible results over the past six years, with several coastal and rural townships delivering massive gains for long-term owners.
Regional SA's top growth suburbs since January 2020
Suburb Region Property type Median price (Dec 2025) 6-year growth Wallaroo Mines Yorke Peninsula House $445,000 249% Risdon Park South Mid North House $329,000 209% Eudunda Mid North House $432,500 198% Port Wakefield Mid North House $410,000 180% Mallala Mid North House $615,000 180% Auburn Clare Valley House $660,000 175% Snowtown Mid North House $220,000 173% Port Victoria Yorke Peninsula House $640,000 164% Blanchetown Riverland House $350,000 162% Seaford Meadows Fleurieu Peninsula House $780,000 162% Regional growth was led by the Yorke Peninsula, where house values in Wallaroo Mines more than tripled since the onset of the pandemic.
The Mid North region was also a major standout, accounting for five of the top ten spots with suburbs like Risdon Park South and Eudunda more than tripling and doubling in value respectively.
From the vineyard-heavy Clare Valley to the riverfront appeal of Blanchetown, the data proves that South Australians have been looking far and wide for value over the last six years.
Note: Data is taken from Domain (January 2020 to December 2025). Suburbs are only included if Domain recorded sufficient sales (10+ sales) to calculate medians for both time periods.
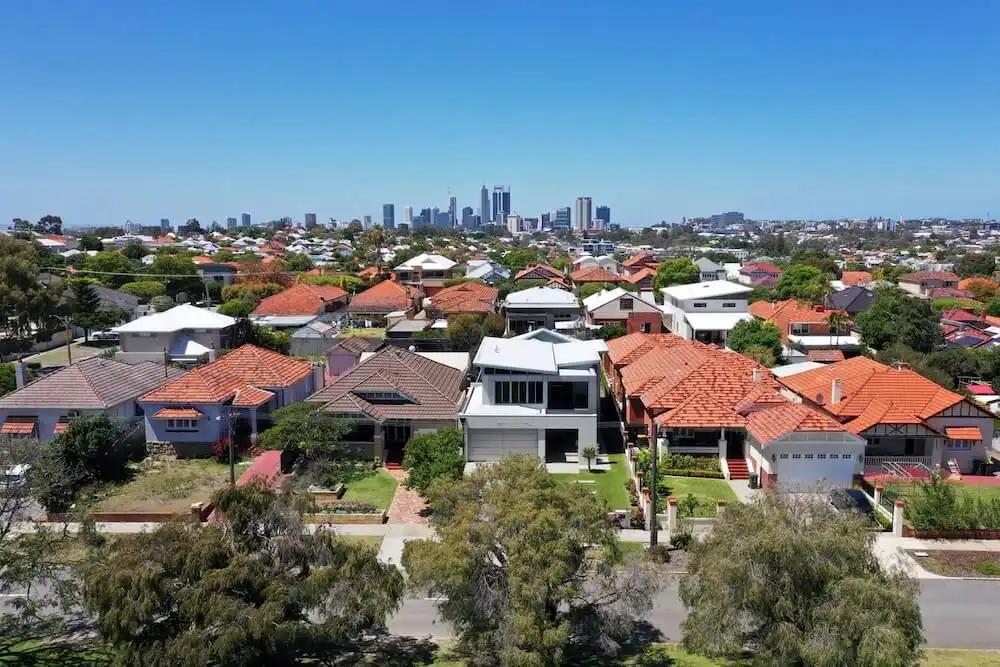
Perth and Western Australia
Perth has been the absolute powerhouse of the national property market since 2020, with growth figures that have often felt like they are in a league of their own.
A rock-solid state economy and a chronic undersupply of homes have created a perfect storm for prices, rewarding homeowners across both the capital and the regions with some truly massive equity gains.
Perth's top growth suburbs since January 2020
Suburb Region Property type Median price (Dec 2025) 6-year growth Mandogalup South West House 33.0% $944,609 Morley North East Unit 26.9% $682,306 Kelmscott South East Unit 25.4% $525,417 Beckenham South East Unit 24.6% $541,195 Cloverdale South East Unit 23.6% $613,651 Dudley Park Mandurah Unit 22.9% $512,493 Haynes South East House 22.8% $740,643 Wandi South West House 22.6% $910,394 Gosnells South East Unit 22.5% $540,125 Cockburn Central South West House 22.4% $950,298 Perth’s southern suburbs have been a major focus for growth, with house values in places like Orelia and Brookdale nearly tripling since the onset of the pandemic.
While houses led the charge initially, the unit market in areas like Armadale and Shoalwater also saw prices nearly triple as buyers looked for more affordable entry points.
This intense competition for entry-level property has been a defining theme for the city, but the results in regional WA have been even more dramatic in some spots.
Regional WA's top growth suburbs since January 2020
Suburb Region Property type Median price (Dec 2025) 6-year growth Rangeway North House $378,000 375% Utakarra North House $459,444 217% Cunderdin East House $405,000 212% Abbey Busselton-Dunsborough & Surrounds House $1,485,000 200% Northampton North House $368,500 195% Dudley Park Mandurah & surrounds Apartment $522,550 190% Spalding North House $447,500 189% Morgantown North House $275,000 168% Collie South House $478,000 166% Nulsen South House $310,000 164% The regional list was dominated by the state's north, where house values in the Geraldton suburb of Rangeway nearly quintupled since early 2020.
Coastal lifestyle pockets in the south also featured heavily, with suburbs like Abbey in the Busselton region seeing values triple as more people prioritised space and lifestyle.
From the inland wheat belt to the furthest reaches of the north, the data proves that Western Australia’s boom reached far beyond the fringes of Perth.
Note: Data is taken from Domain (January 2020 to December 2025). Suburbs are only included if Domain recorded sufficient sales (10+ sales) to calculate medians for both time periods.
Hobart and Tasmania
Tasmania saw a massive property boom early in the pandemic as interstate buyers flocked to the Apple Isle for its lifestyle and value.
While the market has settled in recent years, some growth stats since early 2020 have been nothing short of spectacular, particularly in some of the state's more rugged and remote corners.
Tasmania's top growth suburbs since January 2020
Suburb Region Property type Median price (Dec 2025) 6-year growth Hawley Beach Launceston & Northern House $992,500 103% Waverley Launceston & Northern House $450,000 102% Queenstown West Coast House $195,000 101% Campbell Town Launceston & Northern House $440,000 101% George Town Launceston & Northern House $425,000 101% Acton Burnie Devonport & NW Tas House $419,500 100% Ravenswood Launceston & Northern House $415,000 89% Romaine Burnie Devonport & NW Tas House $544,750 88% East Devonport Burnie Devonport & NW Tas House $511,000 85% Hillcrest Burnie Devonport & NW Tas House $433,000 83% The West Coast has been the clear standout for growth over the last six years, with house values in suburbs like Rosebery, Zeehan, and Queenstown all more than doubling since the pandemic began.
This trend was evident right across the top ten list, which was made up entirely of houses in regional areas where buyers could find significant value.
While the regions dominated the highest percentage gains, Hobart still had its own stars; Opossum Bay was the capital’s top performer, with its house market growing 73 per cent to reach a median of $1,050,000.
From the beachside appeal of Hawley Beach to the historic charm of Campbell Town, the data shows that Tasmanian property has been a rewarding investment since 2020.
Note: Data is taken from Domain (January 2020 to December 2025). Suburbs are only included if Domain recorded sufficient sales (10+ sales) to calculate medians for both time periods.
Darwin and the Northern Territory
Darwin emerged as a surprise leader for property growth in 2025, with home values jumping by 18.9 per cent over the year.
After a relatively quiet 2024, the market has bounced back strongly as buyers and investors are drawn to the city’s high yields and more accessible entry points compared to the southern states.
NT's top growth suburbs since January 2020
Suburb Region Property type Median price (Dec 2025) 6-year growth Zuccoli Darwin Area House $636,556 235% Rosebery Darwin Area Apartment $424,550 76% Bakewell Darwin Area Apartment $367,500 73% Coconut Grove Darwin Area Apartment $375,000 70% Moulden Darwin Area House $500,000 67% Gray Darwin Area House $510,000 59% Johnston Darwin Area Apartment $440,000 59% Ludmilla Darwin Area House $731,000 54% Muirhead Darwin Area House $777,500 53% Marrakai Darwin Area House $459,600 53% Growth in the Top End has been heavily concentrated in the Palmerston region, which claimed every single spot in the territory's top ten list.
The house market in Zuccoli has been the standout performer, with values more than tripling since the start of 2020. While houses in suburbs like Moulden and Gray have seen significant gains, the apartment market has also been incredibly strong, with units in Rosebery and Bakewell both rewarding owners with growth of more than 70 per cent.
Note: Data is taken from Domain (January 2020 to December 2025). Suburbs are only included if Domain recorded sufficient sales (10+ sales) to calculate medians for both time periods.
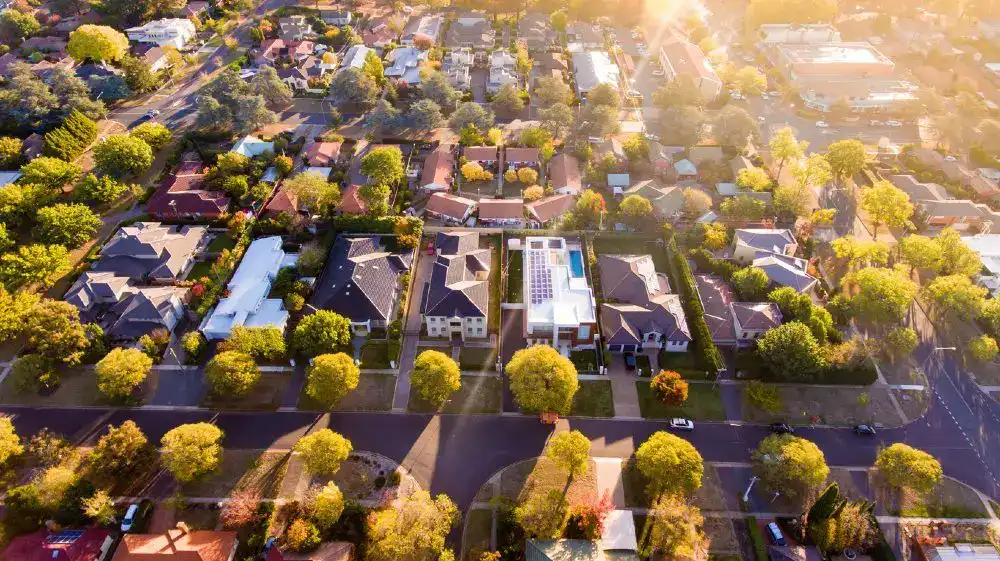
Canberra and the Australian Capital Territory
The ACT has seen a more measured and sustainable rate of growth since the onset of the pandemic compared to the heat of the mid-sized capitals.
Despite this, specific pockets across Canberra's property market have still delivered double-digit returns for homeowners who bought in before the pandemic-era boom took hold.
ACT's top growth suburbs since January 2020
Suburb Region Property type Median price (Dec 2025) 6-year growth Whitlam Inner North House $1,200,100 206% Strathnairn Belconnen House $900,000 107% Throsby Gungahlin House $890,000 78% Taylor Gungahlin House $842,500 69% Denman Prospect Woden Valley House $831,000 58% Macarthur Tuggeranong House $1,090,000 57% Scullin Belconnen Apartment $387,500 56% Curtin Woden Valley Apartment $370,000 54% Mawson Woden Valley Apartment $415,000 54% Watson Inner North House $975,000 52% The Molonglo Valley and Belconnen regions have been the main drivers of growth over the past six years.
Whitlam was the standout performer on the list, with house values more than tripling since early 2020, while Strathnairn followed behind by more than doubling in value.
While houses dominated the highest growth brackets, the apartment market in areas like Scullin and Curtin also performed well, showing that there have been plenty of opportunities for growth across different property types in the capital.
Note: Data is taken from Domain (January 2020 to December 2025). Suburbs are only included if Domain recorded sufficient sales (10+ sales) to calculate medians for both time periods.
Thinking of selling in 2026?
If you're considering getting in on the action this year, it's important to be as prepared as possible in order to cut through the competition and achieve a standout result.
Step 1: Understanding how your market is performing
Every market is different, and understanding your local market is fundamental to making the right selling decisions. Our guide to tracking market trends and data will help you to get a clear picture of how your market is performing and how that impacts you as a seller.
Step 2: Know what your property might be worth
Getting a free home value estimate is a great way to set a foundation for your selling expectations and begin planning the path forward.
Step 3: Get a no-obligation market appraisal from a top real estate agent
Understand what your property could sell for in the current market by speaking to the top-performing agents in your suburb. Comparing top agents in your area will help you find the perfect partner for your selling journey and move towards a successful result.
Step 4: Finally, get your property listing-ready
Taking a thorough approach to preparing your home for sale is another critical step. From cleaning, decluttering, painting and performing other cosmetic renovations to home staging, photography and marketing, getting your property to sale-ready condition is a must.