
Find the top real estate agents in SA
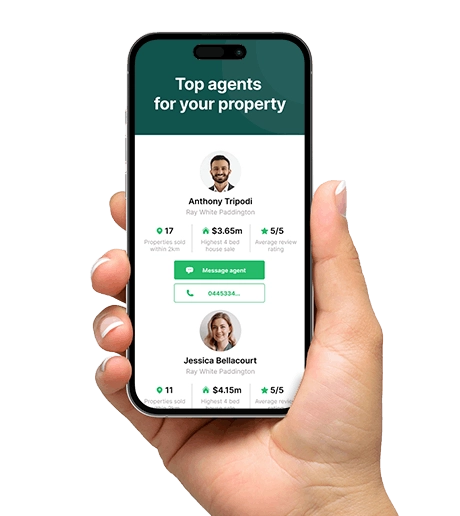
As Australia's #1 real estate agent comparison site, we help over 2 million Australians research agents every year.*

Erica - Glenroy

Mark - Deeragun

Todd - Armadale
We help over 2 million Australians research agents every year

Janet - Nerang

Rachel - Tweed Heads

Nathan - Mt Druitt
What makes selling in South Australia unique?
South Australia combines a compact, service-oriented capital with a string of distinctive regional draws. Adelaide remains the state's main employment and lifestyle centre, attractive to professionals, public sector and university-linked households who prioritise proximity to major health and education hubs and established amenity. Median prices have grown solidly, up 11.9% on the year to $810,000, the highest level in five years, and in the last year, 28,982 properties were listed.
Beyond Adelaide, the Barossa and Clare Valley wine regions draw buyers looking for vineyard-adjacent living, while the Yorke Peninsula attracts people after coastal weekend and holiday properties. The Eyre Peninsula and Outback SA support fishing, aquaculture and agriculture communities and are seeing rising interest from buyers seeking coastal lifestyle and remote work options, supported by steady infrastructure upgrades. For sellers, the practical differences matter: in Adelaide, emphasise proximity to hospitals, universities and major employment precincts and easy access to cultural amenities when marketing to professionals and downsizers. There have been fewer sales than a year ago, down 6.5% on the year.
The average commission rate is 1.84% (around $15,000 on a median-priced home). Real estate agents in SA typically set lower rates in Adelaide because higher property values and denser competition allow for tighter margins, while in regional areas rates often increase to reflect longer campaign periods and broader marketing reach. When selecting an agent, look beyond the commission rate. Compare their specific track record in your local area, their recent sales volume, and their experience with properties similar to yours. Receive a personalised shortlist of top agents in your local area from our agent comparison tool to sell more confidently.
Last Updated: June 2026


FAQs on how to sell your property in SA
These are the general steps to follow when selling a property in SA.
- Find and Shortlist Agents: Start by searching your suburb to see which agents have the best track record for your property type. We recommend interviewing at least two or three agents to compare their strategies. OpenAgent can provide a shortlist of top agents who specialise in your specific area and property type based on our unique performance data.
- Sign a Sales Agency Agreement: Once you've selected an agent, you'll sign a Sales Agency Agreement. This is the legal contract that outlines the agreed commission, the marketing budget, and whether the agent has "Sole Agency" or "Exclusive Agency" rights to sell your home.
- Prepare the Form 1 (Vendor's Statement): The Form 1 is a disclosure document that provides the buyer with information about the property, such as zoning and encumbrances. Your agent or conveyancer will coordinate this, as a buyer cannot be legally bound to a sale until they have been "served" this document.
- Marketing and Strategy: Your agent will manage professional photography and listings on major portals. In SA, selling via auction is common for high-demand areas, while private treaty is the standard for most residential sales.
- Contract and Cooling-Off: Once an offer is accepted, both parties sign the contract. In South Australia, the buyer is entitled to a two-business-day cooling-off period, which begins only after they have received both the signed contract and the Form 1. Note that there is no cooling-off period for properties sold at auction.
Real estate agent fees in South Australia are not governed by pricing regulations, meaning they are determined by market competition and the value of your property. On average, commission rates in SA range from 1.2% to 3.2%.
You can use our free Commissions Calculator to see the average rates being charged in your specific SA suburb.
Yes. Because there are no set rates in SA, you have the right to negotiate the commission and marketing fees before signing your agreement. When you use OpenAgent to find your agent, you can review their sales history and performance data upfront, which gives you significant leverage in these discussions.
A common negotiation tactic in the SA market is the tier-based commission. For example, you might agree to a 2% commission up to a certain price and then offer a higher percentage on every dollar achieved above that target.
Tools to help you choose the right agent in SA

SmartSearch
Find an agent you can trust, get the support you need
We've spent the last decade helping sellers connect with top-performing agents to sell their homes.

Commission Calculator
Get fee clarity by calculating average commission rates
Pay the right commission and maximise your sale price. Understand the average agent commission in your suburb.

Interview Guide
Interview potential agents with confidence
Ask the critical top ten questions that reveal experience, strategy, and trust, so you can select an agent with confidence.