
 - https://sketchapp.com --%3e %3ctitle%3eIcon/search%3c/title%3e %3cdesc%3eCreated with Sketch.%3c/desc%3e %3cg id='Icon/search' stroke='none' stroke-width='1' fill='none' fill-rule='evenodd' stroke-linecap='round' stroke-linejoin='round'%3e %3ccircle id='Oval' stroke='%23252525' cx='10.5145111' cy='10.5145111' r='6.99455261'%3e%3c/circle%3e %3cpath d='M15.4908752%2c15.4908752 L20.5515137%2c20.5515137' id='Line' stroke='%23252525'%3e%3c/path%3e %3c/g%3e%3c/svg%3e)

Melbourne property market news - key takeaways
- Melbourne property market softening: Melbourne dwelling values fell -0.6 per cent in April 2026, the second consecutive monthly decline, leaving the city 1.9 per cent below its November 2025 peak.
- Supply tightening but demand soft: Total listings in Melbourne are down -1.4 per cent year on year, yet softer buyer demand means the reduction in stock has not been enough to arrest falling prices.
- Auction results favour buyers: Melbourne's auction clearance rate of 54.9 per cent for the week ending 26 April 2026 sits well below the balanced-market benchmark, giving buyers a clear negotiating edge.
- Rents rising but below national pace: Annual rent growth in Melbourne came in at +4.4 per cent, trailing the national average of +5.7 per cent, with the vacancy rate edging down to 1.4 per cent.
- Rate rises adding to borrowing pressure: The RBA lifted the cash rate to 4.10 per cent in March 2026, and financial markets are pricing in further increases through the year, keeping a firm lid on borrowing capacity.

Get a free property value estimate
Find out how much your property is worth in today’s market.
Melbourne property price movements
Melbourne's property market continued to lose ground in April 2026, extending a softening trend that has been building since late 2025. Two consecutive interest rate rises this year, combined with stretched affordability and weaker buyer sentiment, are making themselves felt in the city's values.
Melbourne property prices - May 2026
Melbourne homes slipped -0.6 per cent in April 2026, the same monthly fall recorded in March, pushing the quarterly decline to -1.5 per cent. Annual growth remains positive at +2.0 per cent, though the gap between where values are now and where they were a year ago is narrowing.
| Property type | Current median price | Monthly change | Quarterly change | Annual change |
|---|---|---|---|---|
| All Melbourne dwellings | $822,969 | -0.6% | -1.5% | +2.0% |
Source: Cotality
The median home value in Melbourne sits at $822,969, down around $4,970 from the prior month. Melbourne is now roughly 1.9 per cent below its cyclical high from November 2025, meaning the city has unwound a meaningful share of the gains made in the first half of last year.
House prices in Melbourne
Melbourne house prices fell -0.8 per cent in April 2026, the sharpest monthly decline across all property types in the city. At -2.1 per cent for the quarter, Melbourne housing market conditions are clearly pointing in one direction for now.
| Property type | Current median price | Monthly change | Quarterly change | Annual change |
|---|---|---|---|---|
| Melbourne houses | $972,734 | -0.8% | -2.1% | +2.5% |
Source: Cotality
The median house value of $972,734 represents a fall of roughly $7,821 compared to the prior month. Annual growth of +2.5 per cent still keeps houses in positive territory year on year, but the pace of quarterly decline suggests that buffer is being gradually worn away.
Unit prices in Melbourne
Melbourne unit prices were nearly flat in April 2026, easing just -0.1 per cent over the month. The quarterly and annual performance of Melbourne unit prices tells a similarly subdued story, with values down -0.2 per cent over three months and up only +0.9 per cent over the year.
| Property type | Current median price | Monthly change | Quarterly change | Annual change |
|---|---|---|---|---|
| Melbourne units | $641,690 | -0.1% | -0.2% | +0.9% |
Source: Cotality
The median unit value of $641,690 is down around $642 from the prior month, a far smaller retreat than the house segment. Units have largely sidestepped the sharper falls hitting houses, which may reflect their relative affordability at a time when borrowing capacity is under pressure. Annual growth of under one per cent shows demand is not strong enough to push values meaningfully higher either.
Melbourne property market forecasts 2026
Australia's Big 4 banks publish annual dwelling price forecasts as part of their economic research, and views on Melbourne in 2026 vary considerably. The spread this year is unusually wide, reflecting genuine disagreement about how much further rate pressure the market can absorb.
- CBA: CBA predicts Melbourne property prices to rise +1.0 per cent over 2026.
- Westpac: Westpac predicts Melbourne property prices to rise +4.0 per cent over 2026.
- NAB: NAB's published forecast is at the Victoria state level; it predicts dwelling prices to rise +2.3 per cent over the next 12 months across Victoria.
- ANZ: ANZ predicts Melbourne property prices to fall -1.7 per cent over 2026.
The Melbourne house price forecast range runs from -1.7 per cent (ANZ) to +4.0 per cent (Westpac), a spread of nearly six percentage points. ANZ is the clear outlier on the downside, while Westpac sits alone at the optimistic end. CBA and NAB cluster closer to flat-to-modest growth, and Melbourne property market predictions as a whole suggest the banks share little consensus on whether the city's current softness deepens or stabilises.
Consultancy KPMG sits well above the Big 4, forecasting +7.0 per cent dwelling growth across 2026 (houses +6.8 per cent, units +7.3 per cent), which is a notably more bullish view than even the most optimistic bank forecast.
RBA cash rate forecast 2026
At its March 2026 meeting, the RBA lifted the cash rate to 4.10 per cent, up from 3.60 per cent at the prior decision. The move reflected ongoing inflationary pressures, tight labour markets and rising energy costs linked to geopolitical tensions. Financial markets and most bank economists are now pricing in further upward pressure on the cash rate through 2026.
- CBA: CBA's latest commentary points to rates remaining near current levels, with limited scope for near-term cuts given persistent inflation.
- Westpac: Similar to CBA, Westpac sees the cash rate holding around current levels in the near term, though it has not ruled out further tightening if inflation remains elevated.
- NAB: NAB's current guidance reflects concern about sticky inflation and tight labour market conditions, suggesting the cash rate may need to rise further before the RBA is confident enough to ease.
- ANZ: ANZ has flagged that its forecast already incorporates at least one further rate increase in 2026, consistent with its expectation for a modest decline in Melbourne values over the year.
What this means for the Melbourne market
A cash rate of 4.10 per cent places real pressure on Melbourne borrowers, given the city's median dwelling value of $822,969. Higher rates reduce how much buyers can borrow, which is already showing up in weaker auction results and softer prices across the city's upper-priced segments.
The rate environment helps explain why the Big 4 forecasts are so spread out. Cameron Kusher, Property Economist at Oz Property Insights, wrote, "With interest rates having risen twice this year, and another increase likely next week with potentially more to come, it seems market confidence has taken a hit. Lower borrowing capacities, a high level of unaffordability, ongoing high inflation and low consumer sentiment appear to be weighing on the market. It's hard to see how over the short-term any of these factors change and I think the slowdown in the market we're seeing right now, with falls in Sydney and Melbourne, are likely to continue over the coming months."
The impact is not felt evenly across the market. First-home buyers and those borrowing at high loan-to-value ratios face the sharpest squeeze in capacity, which is pushing activity toward Melbourne's more affordable outer suburbs and lower-priced unit stock. Established owners with equity are better insulated, but even upgraders are recalibrating budgets in a way that is taking heat out of the premium end.
Several of the Big 4 forecasts were published before the March 2026 rate rise took effect, meaning the full impact may not yet be reflected in bank modelling. Views may be revised in the months ahead as the RBA's next moves become clearer.
Melbourne house prices graphs and charts
Melbourne house price growth over the last 5 years has been a slow recovery after the 2021–22 boom and the subsequent correction. As of Feb 2026, Cotality data shows dwelling values were up by +0.1 per cent over the month, +0.1 per cent over the quarter, and +5.4 per cent over the year, leaving values about -0.7 per cent below the March 2022 record high.
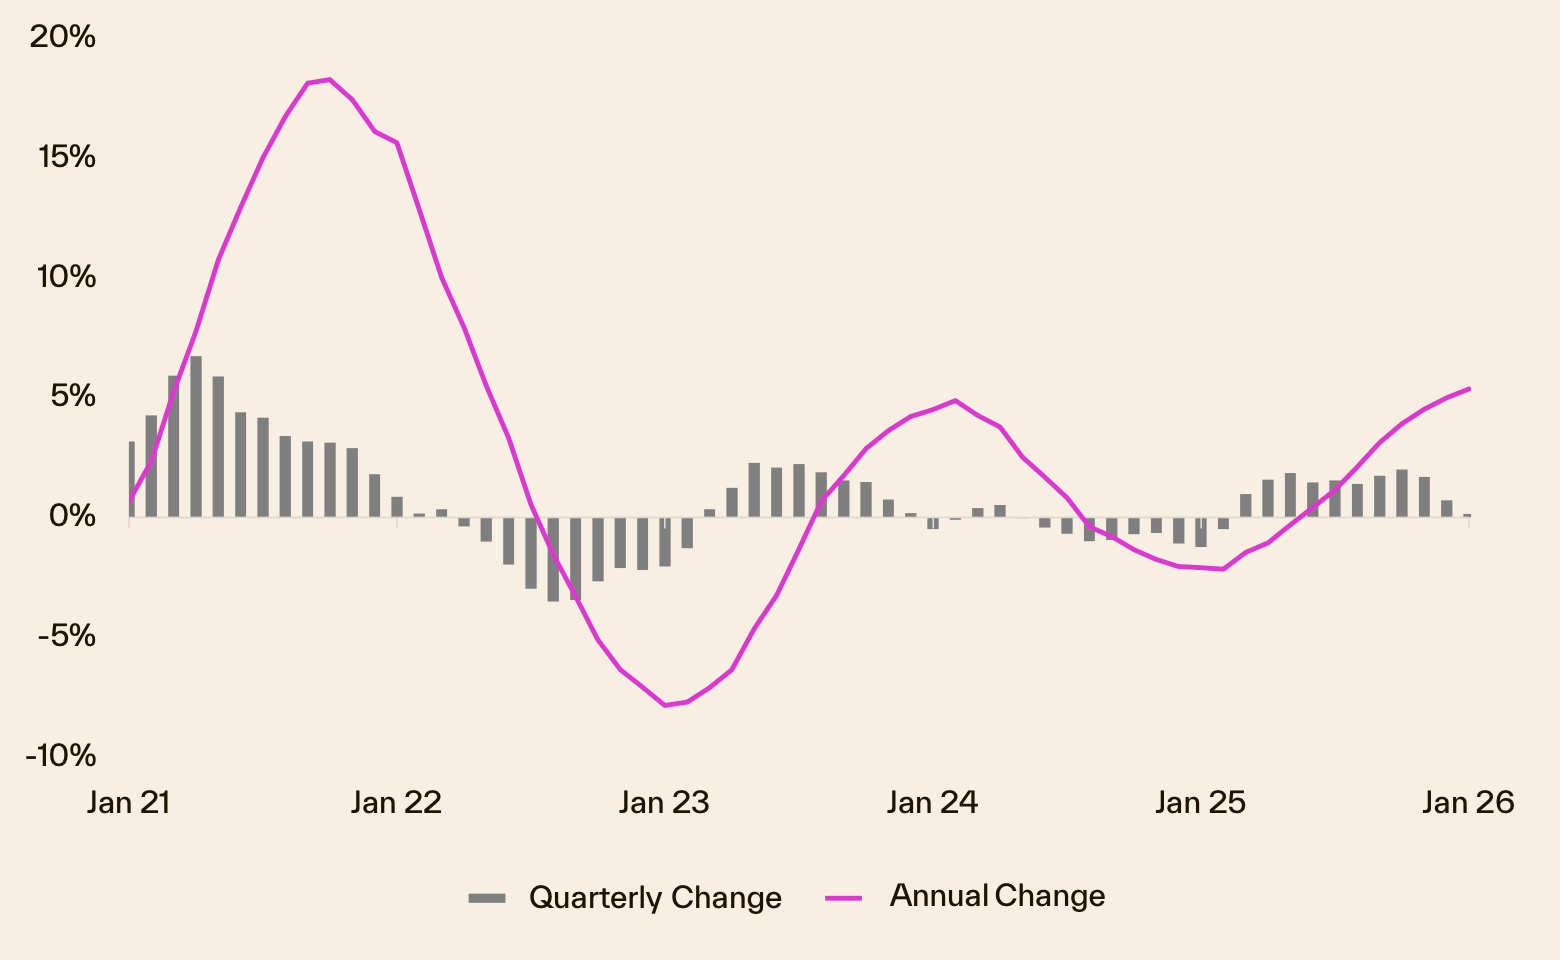
The five-year chart shows Melbourne peaked in March 2022, then moved into an extended negative quarterly phase through 2022 before stabilising and slowly recovering across 2023–2025, with growth re-accelerating into 2025. As per Cotality’s analysis, this recovery has been more gradual than in some mid-sized capitals, reflecting Melbourne’s greater sensitivity to affordability constraints and a slightly higher flow of new listings that has eased some upward pressure on prices.
Melbourne property 30 year property price graph
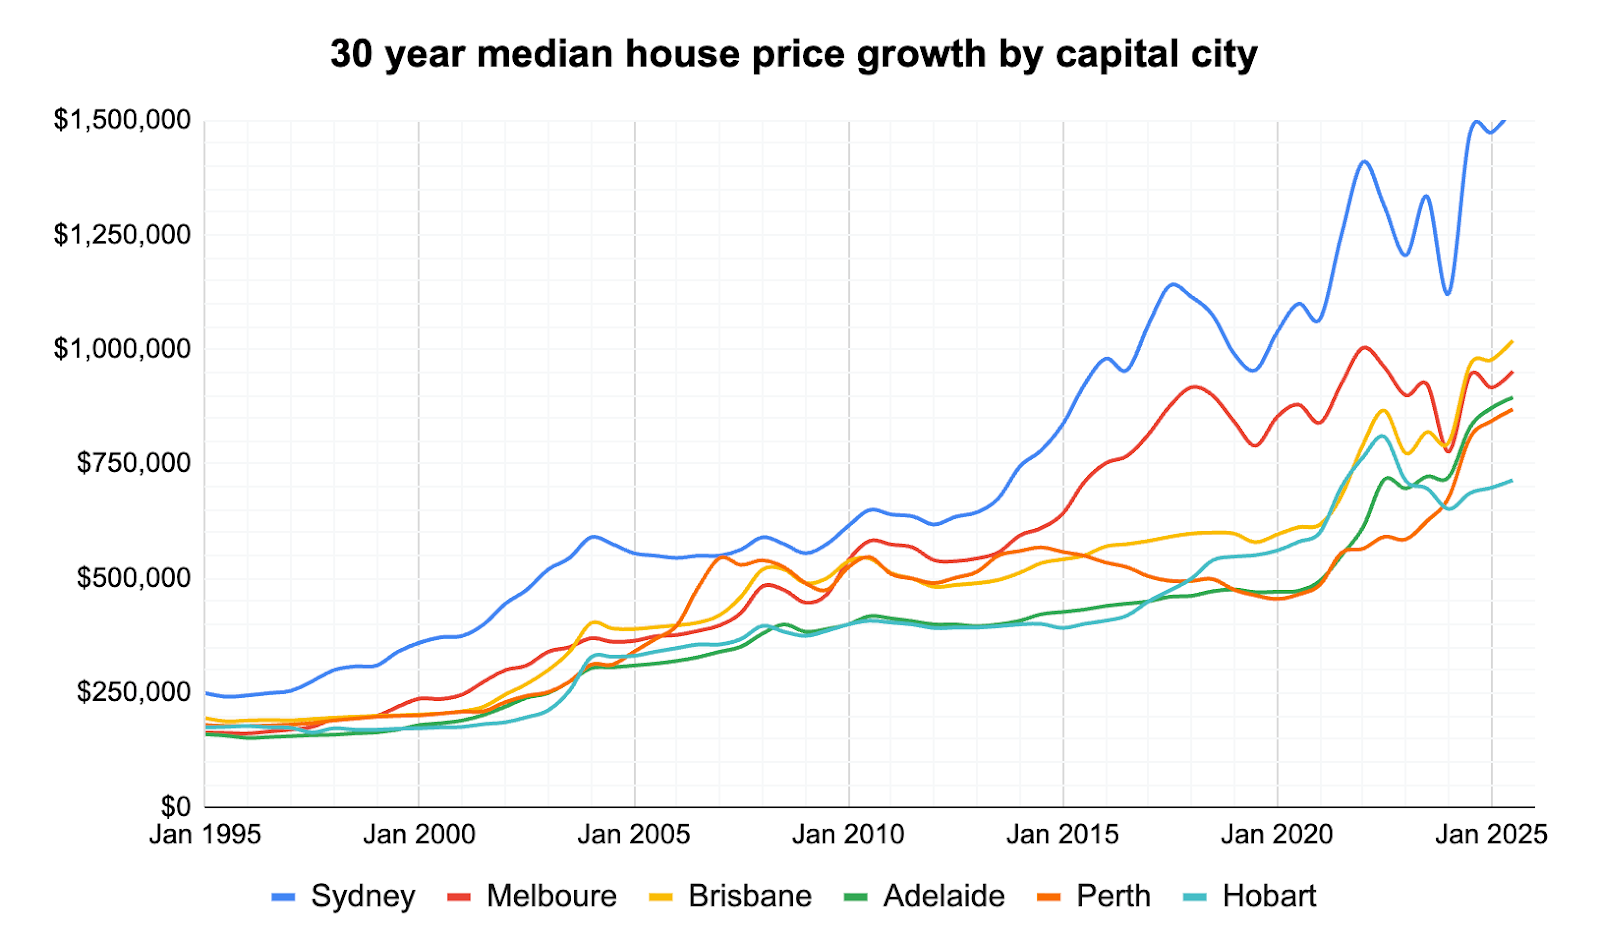
This recent “slow grind” back toward prior highs sits alongside Melbourne property prices growth over the last 10 years, where strong long-run gains were driven by falling interest rates, population growth and constrained supply that together pushed the median much higher; OpenAgent’s historical review shows Melbourne’s median house price rising to roughly $1.1 million by 2025, reflecting that decade-plus of solid appreciation.
Over the past 30 years, Melbourne has repeatedly moved through booms and corrections, and today, homeowners are more cautious while still supported by tight rental markets and ongoing population inflows; supply shortfalls and construction constraints mean demand pressures remain, even as higher borrowing costs temper how fast prices can climb.
Melbourne selling statistics
Melbourne's selling market is showing the clearest signs of a shift toward buyers seen in several years. Sales volumes are up on last year, yet days on market are longer than the combined capitals average, vendor discounts have narrowed only marginally, and auction clearance rates have fallen into territory that firmly favours buyers over sellers.
Melbourne sales volume and days on market
Melbourne recorded sales volumes +9.2 per cent higher year on year, well ahead of the combined capitals average of +2.9 per cent and the national average of +4.7 per cent. At the same time, the typical Melbourne property took 35 days to sell, down from 39 days a year ago. Even with that improvement, Melbourne still sits notably behind the combined capitals benchmark of 27 days and the national figure of 30 days.
| Melbourne sales volume | Melbourne days on market |
|---|---|
| 9.2% Change from 12mo ago | 35 days 39 days 12 mo ago |
Source: Cotality
Melbourne's sales volume growth outpacing the broader market may look like a positive at first glance, but the longer days on market tell a more cautious story. Properties are selling more often than last year, but buyers are not rushing. The gap between Melbourne's 35 days and the combined capitals' 27 days suggests sellers here need to allow more time and more patience than their counterparts in other major cities.
Melbourne new and total listings
New listings fell -3.4 per cent year on year, and total listings were down -1.4 per cent over the same period. Both measures are heading in the same direction, meaning less fresh stock is entering the market and the overall pool of available properties has also edged lower.
| Melbourne new listings | Melbourne total listings |
|---|---|
| -3.4% Change from 12mo ago | -1.4% Change from 12mo ago |
Source: Cotality
The mix of more fresh listings but a much lower total advertised stock means sellers are still cautious about bringing homes to market, keeping overall supply tight even though more homes are appearing each month than a year ago. For buyers, this typically means more choice in the short term from newly listed homes, but continued competition for the limited pool of all advertised properties.
Melbourne vendor discount and auction clearance rates
A tightening in listings would normally give sellers an edge, but that has not been the full picture in Melbourne. Buyer demand has softened alongside supply, so the two forces have largely offset each other rather than tilting conditions in favour of sellers. Price movements in the value section reflect this, fewer listings have not translated into stronger competition at the point of sale.
Melbourne vendor discount
| Mar 2026 | Mar 2025 | |
|---|---|---|
| Melbourne median vendor discount | -3.0% | -3.3% |
Source: Cotality
Melbourne vendors are currently discounting by -3.0 per cent from their initial asking price, compared with -3.3 per cent a year ago. The narrowing is modest, roughly a third of a percentage point. Sellers are conceding slightly less than they were twelve months ago, though the discount remains meaningful and buyers can still expect some room to negotiate.
Melbourne auction clearance rates
| Melbourne | 26 Apr 2026 |
|---|---|
| Total Auctions | 244 |
| Sold | 134 |
| Withdrawn | 29 |
| Passed in | 81 |
| Clearance Rate | 54.9% |
Source: Cotality
Melbourne's auction clearance rate of 54.9 per cent for the week ending 26 April 2026 sits well below the long-run benchmark of around 65 per cent and below the 65-to-75 per cent range that would indicate a balanced market.
Tim Lawless, Research Director at Cotality, said "The softer trend in values coincides with falling auction clearance rates and a pickup in advertised supply, providing buyers with more choice and less urgency at the negotiation table." At a rate barely above 50 per cent, buyers hold a clear advantage at auction right now, and sellers who set an optimistic reserve are likely to find the room less competitive than they had hoped.
Get a deeper insight into how Melbourne sellers are faring in 2026 and what could be on the horizon for the year ahead with some of our latest articles.


Melbourne property investing
Melbourne's rental market is tight by historical standards, but it tells a different story depending on whether you're a renter or an investor. Renters are facing persistent pressure with vacancy near record lows, while investors are seeing yields improve as rental growth outpaces the city's softening capital values.
Melbourne rental market
The table below covers annual rent growth, gross rental yield, and the breakdown of that rent growth between houses and units across Australia's capital cities and broader market groupings. Melbourne's figures sit alongside the national picture for context.
| Location | Rental rates | Rental yield | Annual change in rents, houses | Annual change in rents, units |
|---|---|---|---|---|
| National | 5.7% | 3.6% | NA | NA |
| Combined Capitals | 5.6% | 3.4% | NA | NA |
| Combined Regional | 6.0% | 4.2% | NA | NA |
| Sydney | 5.9% | 3.1% | 6.0% | 5.5% |
| Melbourne | 4.4% | 3.7% | 4.3% | 4.9% |
| Brisbane | 6.7% | 3.3% | 6.5% | 6.4% |
| Adelaide | 3.6% | 3.4% | 3.2% | 3.7% |
| Perth | 6.7% | 3.7% | 7.0% | 7.4% |
| Hobart | 6.4% | 4.3% | 7.0% | 5.5% |
| Darwin | 9.2% | 6.0% | 8.8% | 9.8% |
| Canberra | 2.6% | 4.0% | 3.3% | 2.0% |
Source: Cotality
Melbourne's annual rent growth of +4.4 per cent is below the national average of +5.7 per cent and below every major capital except Adelaide and Canberra. Units are leading the charge at +4.9 per cent annually, nudging ahead of houses at +4.3 per cent, likely reflecting stronger demand for more affordable dwellings as borrowing capacity tightens.
At 3.7 per cent, Melbourne's gross yield matches Perth and sits comfortably above Sydney's 3.1 per cent. That yield improvement is being driven partly by values softening faster than rents, a pattern that benefits investors holding existing stock, but one that still leaves most Melbourne landlords well below the cost of servicing a current mortgage.
Melbourne vacancy rates
Vacancy rates measure the share of rental properties sitting empty at any given time. A lower rate signals a tighter market with less choice for renters and more pricing power for landlords. SQM Research data shows Melbourne's vacancy rate eased slightly from 1.5 per cent a year ago to 1.4 per cent in April 2026, with total vacancies falling from 8,194 to 7,549 properties.
| Location | Mar 2026 vacancy rates | Mar 2026 vacancies | Mar 2025 vacancy rates | Mar 2025 vacancies |
|---|---|---|---|---|
| National | 1.0% | 31,732 | 1.1% | 34,428 |
| Sydney | 1.1% | 8,469 | 1.3% | 9,412 |
| Melbourne | 1.4% | 7,549 | 1.5% | 8,194 |
| Brisbane | 0.8% | 2,662 | 0.9% | 3,207 |
| Adelaide | 0.7% | 1,071 | 0.6% | 988 |
| Perth | 0.5% | 988 | 0.6% | 1,091 |
| Hobart | 0.4% | 121 | 0.5% | 148 |
| Darwin | 0.4% | 93 | 0.8% | 210 |
| Canberra | 1.1% | 700 | 1.5% | 909 |
Source: SQM Research
Melbourne's 1.4 per cent vacancy rate is the highest among the tracked capitals, sitting well above the national rate of 1.0 per cent. That gap is worth keeping in mind: while Melbourne is technically a tight market, renters here have comparatively more choice than in Brisbane, Perth or Hobart, where vacancies are at critically constrained levels of 0.8 per cent or lower.
For investors, the slight year-on-year easing in Melbourne's vacancy rate is a modest positive signal. Fewer empty properties means steadier rental income and less downtime between tenancies, even if the city isn't experiencing the acute tightness seen elsewhere.
Louis Christopher, Managing Director at SQM Research said in the latest SQM rental market report:
"The national vacancy rate dropping to 1.0% highlights just how tight Australia's rental market has become. We are now seeing vacancy rates at critically low levels in several cities, particularly Perth, Darwin and Hobart."
Melbourne isn't among the cities Christopher flags as critically constrained, and the data backs that up. At 1.4 per cent, there is some breathing room compared to the rest of the country. Even so, with vacancy rates continuing to trend downward in Melbourne, the structural pressure on rents is unlikely to ease materially in the near term, which keeps the investment case for rental income relatively intact.
Highest growth areas in Melbourne
Melbourne's strongest annual price gains in April 2026 are concentrated in the city's outer suburbs, where relative affordability is drawing buyers away from the more expensive inner and middle rings. The table below ranks the top 10 Statistical Area Level 3 (SA3) regions across Greater Melbourne by annual percentage change, each SA3 is an ABS geographic unit that typically covers several adjacent suburbs.
| Rank | SA3 Name | SA4 Name | Median Value | Annual % Change |
|---|---|---|---|---|
| 1 | Frankston | Mornington Peninsula | $844,559 | +9.0% |
| 2 | Sunbury | North West | $743,222 | +8.9% |
| 3 | Brimbank | West | $731,253 | +8.0% |
| 4 | Keilor | North West | $1,064,368 | +7.1% |
| 5 | Casey - South | South East | $814,309 | +6.3% |
| 6 | Tullamarine - Broadmeadows | North West | $739,725 | +6.2% |
| 7 | Whittlesea - Wallan | North East | $783,013 | +5.9% |
| 8 | Cardinia | South East | $786,549 | +5.8% |
| 9 | Dandenong | South East | $782,483 | +5.5% |
| 10 | Wyndham | West | $712,277 | +5.2% |
Source: Cotality
Highlights for Melbourne’s high growth areas
- Frankston: Ranked #1 with annual growth of +9.0 per cent and a median value of $844,559, Frankston leads Melbourne's top performers by a clear margin. Its position on the Mornington Peninsula fringe, combined with relatively accessible price points and coastal lifestyle appeal, is drawing buyers who can no longer stretch to inner or middle-ring alternatives.
- Sunbury: Ranked #2 with +8.9 per cent annual growth and a median value of $743,222, Sunbury sits in Melbourne's North West corridor and is one of the city's most affordable broadhectare growth areas. Its proximity to the airport employment precinct and established community infrastructure supports sustained buyer interest from families and first-home buyers alike.
- Brimbank: Ranked #3 with +8.0 per cent annual growth and a median of $731,253, Brimbank is one of Melbourne's most affordable established suburbs in the western corridor. Strong demand from buyers seeking value within a reasonable distance of the CBD has kept upward pressure on prices even as the broader market softens.
- North West corridor: Ranks #4 and #6, Keilor (+7.1 per cent, $1,064,368) and Tullamarine - Broadmeadows (+6.2 per cent, $739,725), both sit within Melbourne's North West SA4 and benefit from proximity to the airport, major arterials and ongoing industrial and employment growth in the region. Keilor's notably higher median reflects its more established housing stock relative to its corridor neighbours.
- South East and outer growth belt: Ranks #5, #7, #8, #9 and #10 span the city's south-eastern and outer growth corridor, Casey - South (+6.3 per cent, $814,309), Whittlesea - Wallan (+5.9 per cent, $783,013), Cardinia (+5.8 per cent, $786,549), Dandenong (+5.5 per cent, $782,483) and Wyndham (+5.2 per cent, $712,277), all sit below the city-wide median of $822,969, pointing to a pattern where affordability is the primary engine of demand across Melbourne's outer ring.
View agent & property tools

Our powerful property tools

