
 - https://sketchapp.com --%3e %3ctitle%3eIcon/search%3c/title%3e %3cdesc%3eCreated with Sketch.%3c/desc%3e %3cg id='Icon/search' stroke='none' stroke-width='1' fill='none' fill-rule='evenodd' stroke-linecap='round' stroke-linejoin='round'%3e %3ccircle id='Oval' stroke='%23252525' cx='10.5145111' cy='10.5145111' r='6.99455261'%3e%3c/circle%3e %3cpath d='M15.4908752%2c15.4908752 L20.5515137%2c20.5515137' id='Line' stroke='%23252525'%3e%3c/path%3e %3c/g%3e%3c/svg%3e)

Adelaide property market news - key takeaways
- Adelaide property keeps climbing: Adelaide dwelling values rose +1.1 per cent in April 2026 and +12.2 per cent annually, with houses and units both recording gains while Sydney and Melbourne slid.
- Stock remains thin: Total listings in Adelaide fell -6.0 per cent year on year, while sales volumes rose +8.0 per cent, meaning buyers are competing for a shrinking pool of available homes.
- Auctions favour sellers: Adelaide's auction clearance rate reached 68.8 per cent in the week ending 26 April 2026, with 95 of 138 properties sold, keeping the balance of power firmly with vendors.
- Vacancy near record lows: Adelaide's rental vacancy rate sits at just 0.7 per cent, with annual rent growth of +3.6 per cent, pointing to tight conditions that show little sign of easing.
- Rate pressure builds: The RBA lifted the cash rate to 4.10 per cent in March 2026, with financial markets pricing in further increases through the year, adding to borrowing costs for Adelaide buyers.

Get a free property value estimate
Find out how much your property is worth in today’s market.
Adelaide property price movements
Adelaide's property market continued to push higher in April 2026, recording gains across every measure while much of the country was losing momentum. The city is one of a handful of capitals where buyers are still competing firmly for stock, and the numbers reflect that clearly.
Adelaide property prices - May 2026
Adelaide's property market delivered another strong month in April 2026, with the typical home value rising +1.1 per cent over the month. On an annual basis, values are up +12.2 per cent, one of the highest rates of growth among Australia's capital cities.
| Property type | Current median price | Monthly change | Quarterly change | Annual change |
|---|---|---|---|---|
| All Adelaide dwellings | $944,673 | +1.1% | +3.5% | +12.2% |
Source: Cotality
The median value for all homes now sits at $944,673, up from approximately $934,396 the prior month, meaning the typical Adelaide home gained around $10,277 in a single month. Quarterly growth of +3.5 per cent tells a consistent story: this is not a one-month spike but a market that has been building steadily through early 2026.
House prices in Adelaide
Adelaide house prices rose +1.0 per cent in April 2026, with the median now at $1,006,099, and annual growth of +12.1 per cent shows the pace has been remarkably steady. Adelaide housing market conditions stand in clear contrast to Sydney and Melbourne, where values have been sliding since late 2025.
| Property type | Current median price | Monthly change | Quarterly change | Annual change |
|---|---|---|---|---|
| Adelaide houses | $1,006,099 | +1.0% | +3.5% | +12.1% |
Source: Cotality
The prior-month house median works out to approximately $996,138, meaning the typical house added around $9,961 over April. The quarterly gain of +3.5 per cent confirms buyers have been absorbing available stock at a consistent rate throughout the first part of the year.
Unit prices in Adelaide
Adelaide unit prices outpaced houses in April 2026, rising +1.3 per cent over the month to a median of $692,676, and annual growth of +13.4 per cent makes units the stronger performer across both timeframes. For buyers priced out of the house market, units are not offering the relief they once did.
| Property type | Current median price | Monthly change | Quarterly change | Annual change |
|---|---|---|---|---|
| Adelaide units | $692,676 | +1.3% | +3.5% | +13.4% |
Source: Cotality
The prior-month unit median was approximately $683,788, so the typical unit added around $8,888 over April alone. The +3.5 per cent quarterly gain mirrors house performance exactly, suggesting demand is broad-based across property types rather than concentrated in one segment.
Adelaide property market forecasts 2026
Australia's Big 4 banks, CBA, Westpac, NAB and ANZ, each publish annual dwelling price forecasts as part of their economic research. For Adelaide in 2026, views across the Big 4 vary considerably, reflecting genuine uncertainty about how rising rates will land in a market that has been one of the country's strongest performers.
- CBA: CBA predicts Adelaide property prices to rise +9.0 per cent over 2026.
- Westpac: Westpac predicts Adelaide property prices to rise +6.0 per cent over 2026.
- NAB: NAB's published forecast is at the South Australian state level; it predicts dwelling prices to rise +5.3 per cent over the next 12 months across South Australia.
- ANZ: ANZ predicts Adelaide property prices to rise +5.7 per cent over 2026.
The spread across these Adelaide house price forecast estimates runs from +5.3 per cent (NAB, South Australian state level) to +9.0 per cent (CBA), a gap of nearly four percentage points. CBA sits well above the pack, while Westpac, ANZ and NAB cluster in a tighter band between +5.3 and +6.0 per cent. That clustering suggests a base case of moderate but real growth for the Adelaide property market predictions in 2026, with CBA's more bullish call reflecting a view that Adelaide's relative affordability and migration-driven demand will absorb rate pressure better than other capitals.
Consultancy KPMG sits above the Westpac-to-ANZ cluster but below CBA, forecasting +7.4 per cent dwelling growth across 2026 (houses +8.2 per cent, units +6.6 per cent).
RBA cash rate forecast 2026
At its March 2026 meeting, the Reserve Bank of Australia lifted the cash rate to 4.10 per cent, up from 3.60 per cent previously. The decision reflected persistent inflationary pressures, a tight labour market, and energy price risks tied to the conflict in the Middle East. Financial markets are pricing in further upward pressure on rates through 2026, and the Big 4 banks each hold a view on where the cash rate goes from here.
- CBA: CBA's latest commentary points to rates remaining elevated through 2026, with limited scope for cuts until inflation shows a sustained return toward target.
- Westpac: Similar to CBA, Westpac expects the cash rate to stay high for an extended period, with any easing unlikely before late 2026 at the earliest.
- NAB: NAB has not published a revised cash rate forecast since the March RBA decision, but its recent commentary points in the same direction as the broader expectation that rates will remain near current levels or move modestly higher before easing.
- ANZ: ANZ expects further rate pressure in the near term, consistent with financial market pricing for at least one or two additional increases through the remainder of 2026.
What this means for the Adelaide market
A cash rate of 4.10 per cent translates directly into higher monthly repayments for Adelaide buyers. At that rate, borrowing capacity is materially lower than it was 12 months ago, which puts pressure on both the price a buyer can stretch to and the number of buyers who can comfortably enter the market.
For Adelaide specifically, the impact is softened slightly by the city's lower median values relative to Sydney or Melbourne. Buyers looking at Adelaide's median dwelling of $944,673 are servicing a smaller loan than their counterparts in the southern capitals, which means rate rises, while painful, leave more breathing room in household budgets. Units, with a median of $692,676, are likely to attract stronger relative demand from borrowers whose capacity has been compressed, consistent with the pattern emerging across all capital cities.
Several of the Big 4 forecasts were finalised before the March 2026 rate decision, meaning the full effect of the latest hike may not yet be embedded in their numbers. Bank forecasts are typically revised quarterly, so updated views from one or more banks could emerge in the months ahead.
Adelaide house prices graphs and charts
Adelaide house price growth over the last 5 years has been a steady recovery from the 2022 slowdown and moved into a clear upswing by early 2026. As per Cotality’s analysis, dwelling values were up by +1.2 per cent in January, +4.7 per cent over the quarter and +9.7 per cent over the year, with values now at a record high.
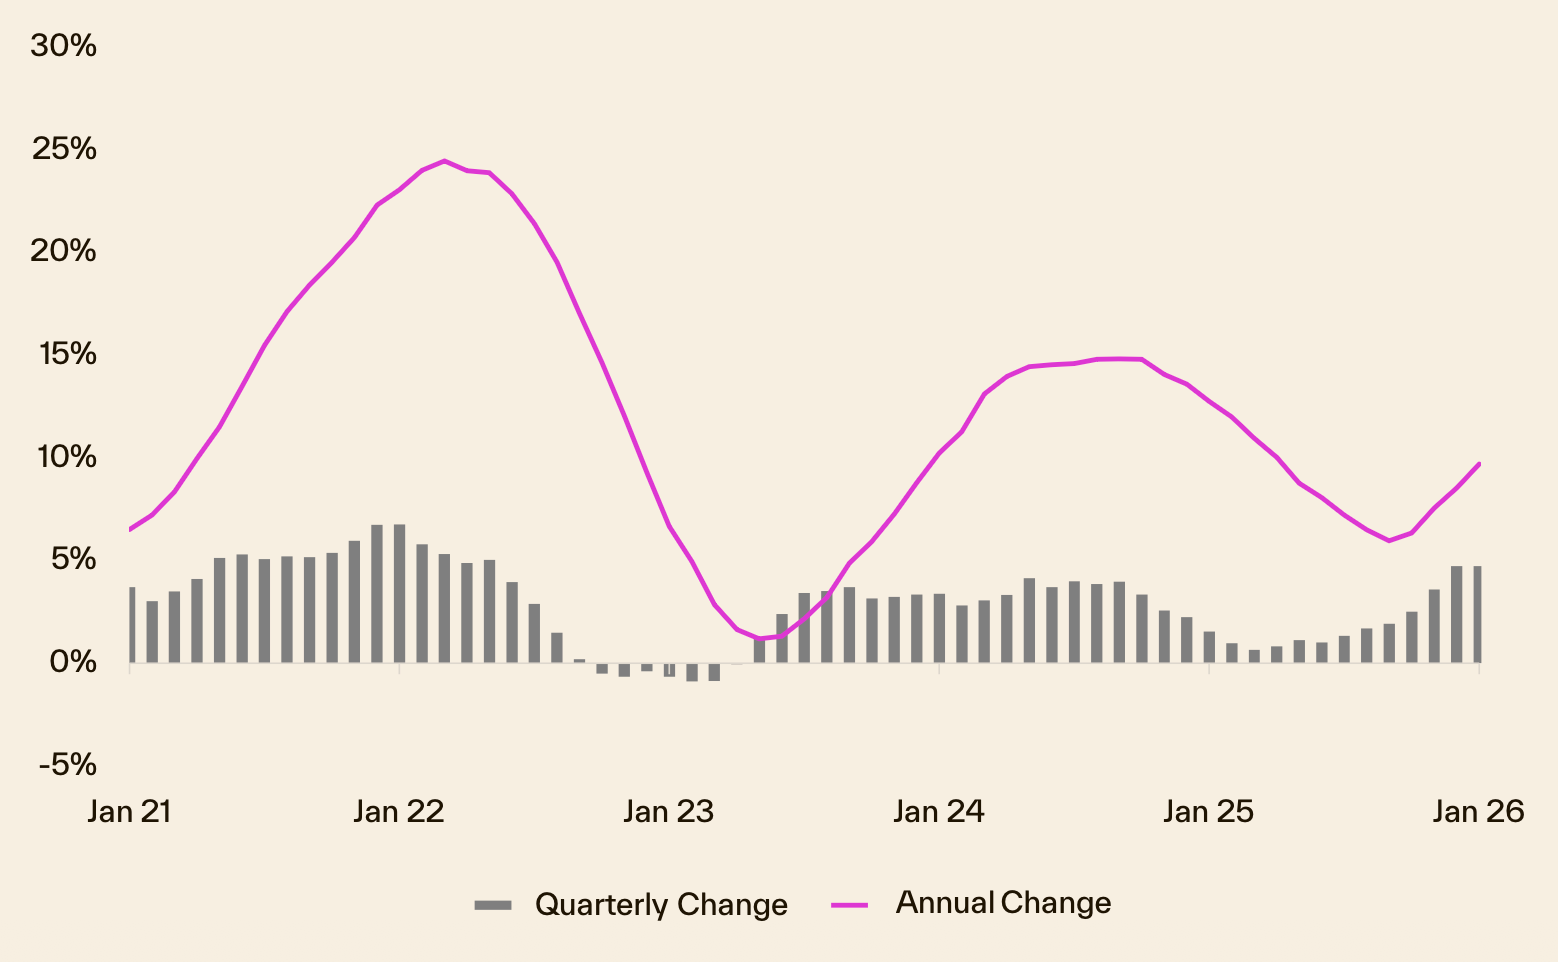
The five‑year chart shows Adelaide’s 2021 COVID boom, a shorter and shallower cooling through 2022, then a steady recovery from 2023 into a faster re‑acceleration in 2024–2025 driven by tight listings and strong demand. Cotality’s notes highlight low inventory, faster days on market and limited discounting as key reasons Adelaide has broadly held most of its COVID gains and pushed beyond previous peaks.
Adelaide property 30 year property price graph
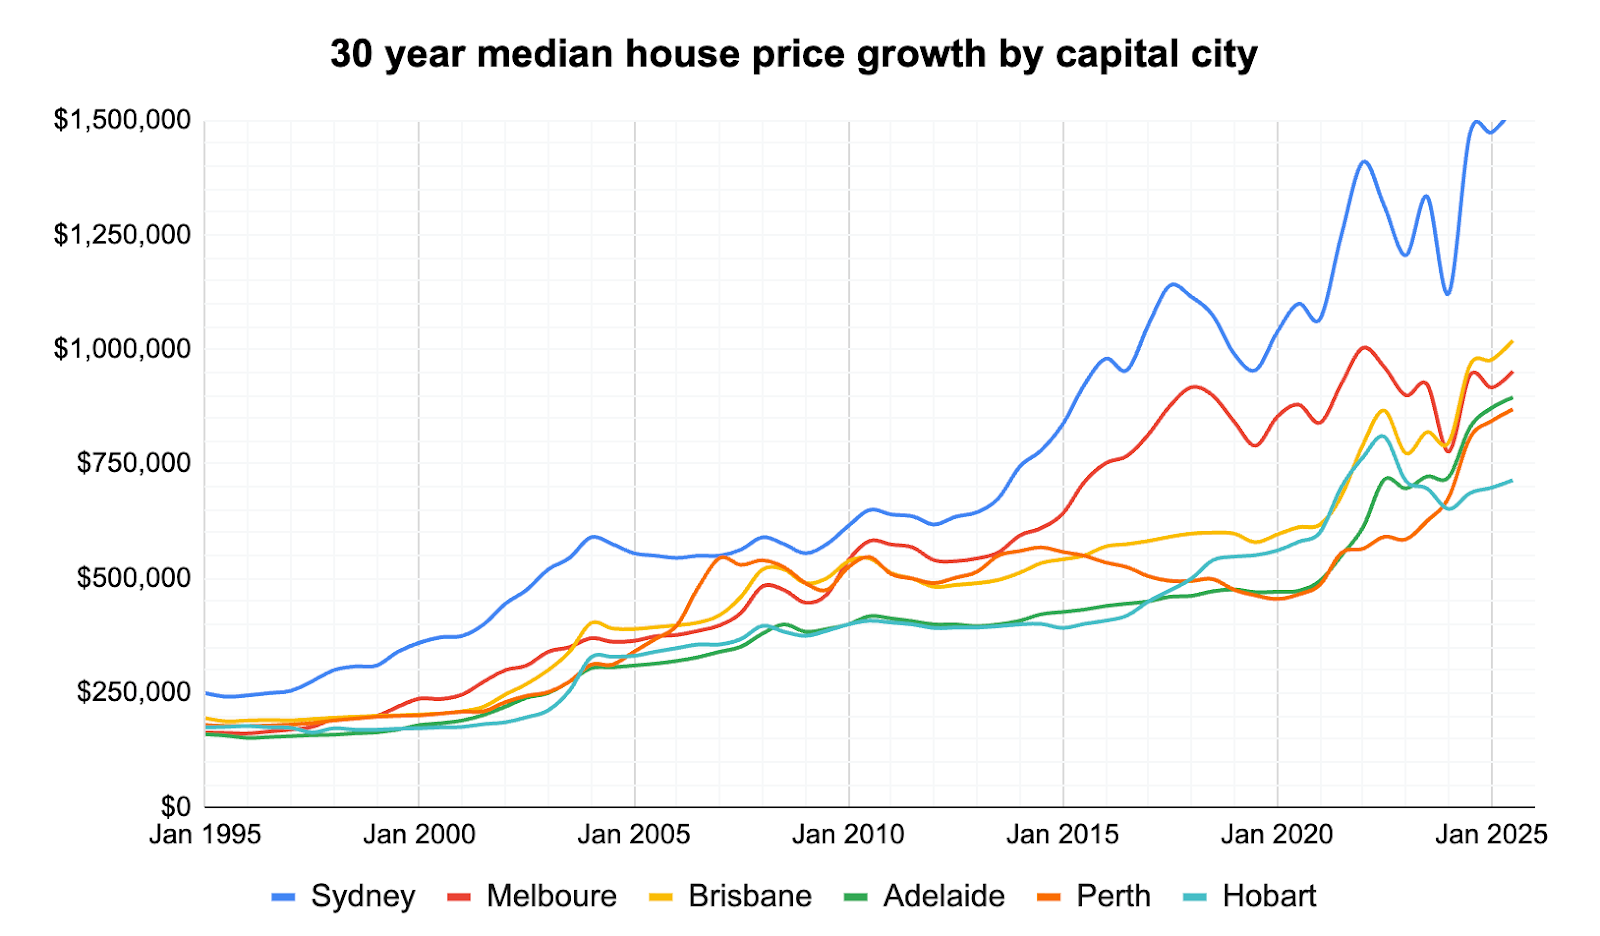
Recent strength builds on a much longer rise in values — Adelaide property prices growth over the last 10 years has been pronounced, roughly doubling in that period as population inflows, low historical interest rates and constrained supply pushed medians sharply higher.
Over the past three decades, Adelaide has delivered steady long‑term gains despite periods of flat growth, the GFC wobble and the COVID surge; homeowners today generally feel positive because many held through earlier dips and now sit on strong equity, while buyers are more cautious because affordability and tight rental markets make entry harder. The city’s recent upswing is also shaped by supply shortages, low vacancy rates and changing interest‑rate cycles, so sentiment is a mix of confidence for owners and frustration for aspiring buyers.
Adelaide selling statistics
Adelaide's selling market remains firmly in sellers' territory. Stock is thin, homes are moving quickly, and buyers are conceding very little ground at the negotiating table, even as broader national conditions show signs of softening.
Adelaide sales volume and days on market
Adelaide recorded sales volumes +8.0 per cent year on year in April 2026, well ahead of the combined capitals average of +2.9 per cent and the national figure of +4.7 per cent. Homes are selling in 32 days on average, down from 36 days a year ago, pointing to a faster-moving market than this time last year.
| Adelaide sales volume | Adelaide days on market |
|---|---|
| +8.0% Change from 12mo ago | 32 days 36 days 12 mo ago |
Source: Cotality
Adelaide's 32-day median sits above the combined capitals average of 27 days but below the national average of 30 days, placing the city somewhere between the country's fastest and slowest movers. For buyers, that means homes are not flying off the shelf at Sydney speeds, but there is still limited time to deliberate before a property is gone.
Adelaide new and total listings
New listings fell -2.4 per cent year on year, while total listings dropped -6.0 per cent over the same period. Fewer homes are coming to market, and the ones that do are not sitting around long enough to build up available stock.
| Adelaide new listings | Adelaide total listings |
|---|---|
| -2.4% Change from 12mo ago | -6.0% Change from 12mo ago |
Source: Cotality
The combination of falling total listings and rising sales volumes means buyers face a shrinking pool of choice. That supply squeeze has been a consistent feature of Adelaide's price growth story, and there is little in the current listings trend to suggest it will ease soon.
Adelaide vendor discount and auction clearance rates
Vendor discount measures the gap between a property's initial asking price and what it actually sells for, the smaller the gap, the more firmly sellers are holding their ground. Auction clearance rates show what share of properties put to auction find a buyer on the day, giving a real-time read on demand relative to supply.
Adelaide vendor discount
| Mar 2026 | Mar 2025 | |
|---|---|---|
| Adelaide median vendor discount | -3.5% | -3.4% |
Source: Cotality
Adelaide vendors are discounting by -3.5 per cent, fractionally wider than the -3.4 per cent recorded a year ago. The change is negligible, sellers are effectively holding the same negotiating position they were in twelve months ago.
Adelaide auction clearance rates
| Adelaide | 26 Apr 2026 |
|---|---|
| Total Auctions | 138 |
| Sold | 95 |
| Withdrawn | 6 |
| Passed in | 37 |
| Clearance Rate | 68.8% |
Source: Domain
Adelaide recorded a clearance rate of 68.8 per cent for the week ending 26 April 2026, with 95 of 138 auctioned properties sold. That sits comfortably in the firm-to-balanced range, where buyers are active but sellers retain the upper hand at the fall of the hammer.
Get a deeper insight into how Adelaide sellers are faring in 2026 and what could be on the horizon for the remainder of the year with some of our latest articles.


Adelaide property investing
Adelaide's rental market is running tight, with vacancy sitting near record lows and rents continuing to grow across both houses and units. For investors, the picture is one of reliable occupancy and steady income, even if yield levels reflect how sharply values have climbed in recent years.
Adelaide rental market
The table below shows how Adelaide compares to other capitals and national benchmarks across annual rent growth, gross yield, and the split between house and unit rent changes.
| Location | Rental rates | Rental yield | Annual change in rents, houses | Annual change in rents, units |
|---|---|---|---|---|
| National | 5.7% | 3.6% | NA | NA |
| Combined Capitals | 5.6% | 3.4% | NA | NA |
| Combined Regional | 6.0% | 4.2% | NA | NA |
| Sydney | 5.9% | 3.1% | 6.0% | 5.5% |
| Melbourne | 4.4% | 3.7% | 4.3% | 4.9% |
| Brisbane | 6.7% | 3.3% | 6.5% | 6.4% |
| Adelaide | 3.6% | 3.4% | 3.2% | 3.7% |
| Perth | 6.7% | 3.7% | 7.0% | 7.4% |
| Hobart | 6.4% | 4.3% | 7.0% | 5.5% |
| Darwin | 9.2% | 6.0% | 8.8% | 9.8% |
| Canberra | 2.6% | 4.0% | 3.3% | 2.0% |
Source: Cotality
Adelaide's annual rent growth of +3.6 per cent sits below the combined capitals average of +5.6 per cent, placing it among the softer performers nationally alongside Canberra. The gross yield of 3.4 per cent matches the combined capitals benchmark exactly, sitting below cities like Darwin, Hobart and Canberra, which tells you that property values in Adelaide have moved ahead of rents more quickly than in those markets. Units are pulling slightly harder than houses, up +3.7 per cent versus +3.2 per cent for houses, suggesting apartments are seeing a little more rental demand pressure at present.
Adelaide vacancy rates
The vacancy rate is the share of rental properties sitting empty at any given time. A rate below 1.0 per cent is considered critically tight, meaning there are very few options for renters and landlords rarely need to search hard for a tenant. According to SQM data, Adelaide's vacancy rate edged up from 0.6 per cent a year ago to 0.7 per cent in April 2026.
| Location | Mar 2026 vacancy rates | Mar 2026 vacancies | Mar 2025 vacancy rates | Mar 2025 vacancies |
|---|---|---|---|---|
| National | 1.0% | 31,732 | 1.1% | 34,428 |
| Sydney | 1.1% | 8,469 | 1.3% | 9,412 |
| Melbourne | 1.4% | 7,549 | 1.5% | 8,194 |
| Brisbane | 0.8% | 2,662 | 0.9% | 3,207 |
| Adelaide | 0.7% | 1,071 | 0.6% | 988 |
| Perth | 0.5% | 988 | 0.6% | 1,091 |
| Hobart | 0.4% | 121 | 0.5% | 148 |
| Darwin | 0.4% | 93 | 0.8% | 210 |
| Canberra | 1.1% | 700 | 1.5% | 909 |
Source: SQM Research
Adelaide's vacancy rate of 0.7 per cent remains well below the national rate of 1.0 per cent, and only Perth, Hobart and Darwin sit lower. The small year-on-year rise, from 0.6 per cent to 0.7 per cent, represents just 83 additional vacant properties in absolute terms, so conditions have loosened very marginally rather than in any meaningful way. Renters in Adelaide face a market where supply is thin, and investors can expect strong occupancy to continue.
Louis Christopher, Managing Director at SQM Research said in the latest SQM rental market report:
"The national vacancy rate dropping to 1.0% highlights just how tight Australia's rental market has become. We are now seeing vacancy rates at critically low levels in several cities, particularly Perth, Darwin and Hobart."
While Louis Christopher's comments point to the most acute pressure being in Perth, Darwin and Hobart, Adelaide is not far behind at 0.7 per cent. The national tightening he describes is the same structural force keeping Adelaide's vacancy near its historical floor. With no sign of meaningful new rental supply entering the market, investors in Adelaide can expect that pattern to persist through the remainder of 2026.
Highest growth areas in Adelaide
Adelaide's strongest annual price gains in April 2026 are spread across the city's northern suburbs, the inner-east and the outer south. The table below covers the top 10 Statistical Area Level 3 (SA3) regions for Greater Adelaide, where each SA3 is an ABS geographic classification that typically groups several neighbouring suburbs into one measurable area.
| Rank | SA3 Name | SA4 Name | Median Value | Annual % Change |
|---|---|---|---|---|
| 1 | Salisbury | North | $828,467 | 17.1% |
| 2 | Campbelltown (SA) | Central and Hills | $1,176,472 | 16.1% |
| 3 | Tea Tree Gully | North | $940,461 | 14.9% |
| 4 | Gawler - Two Wells | North | $824,949 | 14.7% |
| 5 | Port Adelaide - East | North | $967,556 | 14.3% |
| 6 | Unley | Central and Hills | $1,577,893 | 13.5% |
| 7 | Onkaparinga | South | $897,914 | 13.1% |
| 8 | Adelaide City | Central and Hills | $725,449 | 13.0% |
| 9 | Playford | North | $708,874 | 12.5% |
| 10 | Marion | South | $1,044,092 | 12.2% |
Source: Cotality
Highlights for Adelaide’s high growth areas
- Salisbury: Ranked #1 with annual growth of +17.1 per cent and a median value of $828,467, Salisbury is Adelaide's standout performer over the past 12 months. Its position in the city's northern corridor, combined with a median sitting well below the city-wide average, has drawn buyers seeking more accessible entry points to the Adelaide market.
- Campbelltown (SA): Ranked #2 with +16.1 per cent annual growth and a median of $1,176,472, Campbelltown sits in the Central and Hills SA4 and has attracted buyers who want proximity to the city alongside leafier surroundings. Its growth rate is notable given the higher price point, suggesting demand in this area is being driven by more than affordability alone.
- Tea Tree Gully: Ranked #3 with +14.9 per cent annual growth and a median of $940,461, Tea Tree Gully sits in the northern SA4 and offers a mix of established housing and relative value compared to inner-ring alternatives. Its position between the CBD and the Adelaide Hills has historically appealed to families looking for space without moving too far from services.
- Northern growth corridor: Ranks #4 and #5, Gawler - Two Wells (+14.7 per cent, $824,949) and Port Adelaide - East (+14.3 per cent, $967,556), both sit within the northern SA4 and continue a clear pattern of strong price momentum stretching from the outer fringe to the inner-north. Buyers drawn to the northern corridor by relative affordability are sustaining competition across multiple neighbouring areas simultaneously.
- Broad city-wide reach: Ranks #6 through #10, Unley (+13.5 per cent, $1,577,893), Onkaparinga (+13.1 per cent, $897,914), Adelaide City (+13.0 per cent, $725,449), Playford (+12.5 per cent, $708,874) and Marion (+12.2 per cent, $1,044,092), span the inner-south, outer-south, city centre and deep north, showing that Adelaide's growth story is not confined to a single corridor. The range of medians across these five areas, from $708,874 in Playford to $1,577,893 in Unley, tells us buyers at very different price points are all finding strong conditions across the city.
View agent & property tools

Our powerful property tools

