
 - https://sketchapp.com --%3e %3ctitle%3eIcon/search%3c/title%3e %3cdesc%3eCreated with Sketch.%3c/desc%3e %3cg id='Icon/search' stroke='none' stroke-width='1' fill='none' fill-rule='evenodd' stroke-linecap='round' stroke-linejoin='round'%3e %3ccircle id='Oval' stroke='%23252525' cx='10.5145111' cy='10.5145111' r='6.99455261'%3e%3c/circle%3e %3cpath d='M15.4908752%2c15.4908752 L20.5515137%2c20.5515137' id='Line' stroke='%23252525'%3e%3c/path%3e %3c/g%3e%3c/svg%3e)


Brisbane property market news - key takeaways
- Values ease from peak: Brisbane's median dwelling value dipped -0.6 per cent in July 2026 to $1,104,094, sitting -0.7 per cent below the May 2026 peak with both houses and units pulling back over the month.
- Stock building, buyers gaining choice: Total listings in the Brisbane property market rose +39.5 per cent year on year, with homes now taking 28 days to sell compared with 19 days a year ago.
- Auction conditions favour buyers: Brisbane's auction clearance rate came in at 51.9 per cent for the week ending 16 August 2026, a soft result that places current conditions clearly in buyer-favourable territory.
- Rents climbing, vacancies tight: Annual rent growth in Brisbane reached +6.6 per cent, ahead of the combined capitals average, with the vacancy rate holding at a tight 0.9 per cent.
- Rate cuts pushed into 2027: The RBA is holding the cash rate at 4.35 per cent, and all four major banks now expect the first cut no earlier than mid-2027, keeping borrowing costs elevated for the near term.

Get a free property value estimate
Find out how much your property is worth in today’s market.
Brisbane property price movements
Brisbane's property market eased in July 2026, with values pulling back modestly across both houses and units. The annual picture remains firmly positive, reflecting the strong gains built up over the prior growth cycle.
Brisbane property prices - July 2026
Brisbane's property market recorded a -0.6 per cent fall in values over July 2026, with the quarterly result matching that figure at -0.6 per cent. Annual growth of +14.8 per cent tells the fuller story of how much ground values have covered over the past year.
| Property type | Current median price | Monthly change | Quarterly change | Annual change |
|---|---|---|---|---|
| All Brisbane dwellings | $1,104,094 | -0.6% | -0.6% | +14.8% |
Source: Cotality
The median home value in Brisbane now sits at $1,104,094, down around $6,637 from the prior month. Values remain -0.7 per cent below their May 2026 peak, placing the current softening only two months from that high point.
House prices in Brisbane
Brisbane house prices eased -0.6 per cent over July 2026, extending the quarterly decline to -0.9 per cent. Annual growth of +14.3 per cent across the Brisbane housing market shows that despite the recent pullback, the gains of the past year remain substantial.
| Property type | Current median price | Monthly change | Quarterly change | Annual change |
|---|---|---|---|---|
| Brisbane houses | $1,207,039 | -0.6% | -0.9% | +14.3% |
Source: Cotality
The median Brisbane house value of $1,207,039 represents a fall of around $7,283 from the previous month. Houses have pulled back more than units on a quarterly basis, with the -0.9 per cent quarterly decline roughly double the unit segment's result over the same period.
Unit prices in Brisbane
Brisbane unit prices dipped -0.4 per cent in July 2026, a softer monthly fall than the house segment. Annual growth of +17.1 per cent confirms that Brisbane unit prices have run hard over the past twelve months, outpacing houses on that measure.
| Property type | Current median price | Monthly change | Quarterly change | Annual change |
|---|---|---|---|---|
| Brisbane units | $875,135 | -0.4% | +0.4% | +17.1% |
Source: Cotality
The median unit value of $875,135 edged lower by around $3,514 over the month. Units also held their ground better at the quarterly level, posting a modest +0.4 per cent gain against the house segment's -0.9 per cent, suggesting demand for more affordable price points has remained comparatively steady.
Brisbane property market forecasts 2026
Australia's Big Four banks each publish annual property price forecasts as part of their economic research divisions, and views on Brisbane's outlook for 2026 vary considerably across the group. The spread is wide enough that where you land in the range depends almost entirely on which bank's assumptions you find most persuasive.
- CBA predicts Brisbane property prices to rise +8.0 per cent over 2026.
- Westpac predicts Brisbane property prices to rise +9.0 per cent over 2026.
- NAB's published forecast is at the Queensland state level; it predicts dwelling prices to fall -1.5 per cent over the next 12 months across Queensland.
- ANZ predicts Brisbane property prices to rise +4.0 per cent over 2026.
The Brisbane house price forecast range runs from Westpac's +9.0 per cent at the top to NAB's -1.5 per cent Queensland state figure at the bottom. NAB's number covers Queensland broadly rather than Brisbane specifically, so direct comparison with the city-level forecasts has limits. Among the three banks publishing Brisbane-specific predictions, ANZ sits at the lower end at +4.0 per cent, with CBA and Westpac clustered meaningfully higher at +8.0 and +9.0 per cent respectively.
RBA cash rate forecast 2026-2027
The RBA is currently holding the cash rate at 4.35 per cent, with the most recent decision consistent with consensus expectations following a softer-than-anticipated June inflation reading. All four major banks expect the next move to be a cut, though their timing forecasts spread across 2027, ranging from as early as May to as late as September.
- ANZ expects the next cash-rate move to be a 25 basis point cut, forecasting cuts in September and December 2027 to bring the cash rate to 3.85 per cent.
- CBA expects the next cash-rate move to be a 25 basis point cut, forecasting cuts in May and September 2027 to bring the cash rate to 3.85 per cent.
- NAB expects the next cash-rate move to be a 25 basis point cut, forecasting two more cuts in September and December 2027 to bring the cash rate to 3.60 per cent.
- Westpac expects the next cash-rate move to be a 25 basis point cut, forecasting cuts in August and December 2027 to bring the cash rate to 3.85 per cent.
What this means for the Brisbane market
At 4.35 per cent, the cash rate continues to weigh on borrowing capacity, and Brisbane buyers are feeling that directly. A household borrowing at current rates carries meaningfully less purchasing power than it did before the rate cycle began, and for those looking to enter the market, the gap between what banks will lend and what sellers are asking remains a real constraint, particularly in Brisbane's higher-priced house segment.
The rate environment also helps explain why the forecast spread is so wide. Banks expecting rate cuts to arrive earlier, or in larger increments, tend to hold more positive Brisbane house price trend assumptions, since rate relief feeds directly into buyer demand and borrowing limits. With cuts now pushed firmly into 2027 across all four bank forecasts, any price recovery driven by rate relief is some way off, which lends weight to the more moderate end of the forecast range in the near term.
CBA, Westpac, and NAB's Queensland forecasts all draw on research published in the first half of 2026, before the RBA's most recent hold decision. Their price and rate views may be revisited in the months ahead as updated guidance comes through.
Helpful resource: Our simple guide to tracking market trends and data will walk you through everything you need to know to be able to read the market and make a smarter selling decision.
Brisbane house prices graphs and charts
Brisbane's house price growth over the last 5 years has brought the city to a dwelling median of $1,104,094 as at July 2026, according to Cotality's latest figures, with values edging lower by -0.6 per cent over the month, -0.6 per cent over the quarter, and still sitting +14.8 per cent above where they were a year ago. The monthly and quarterly easing reflects a market that peaked in May 2026 and has since pulled back modestly, though the strength of annual growth shows how far values have climbed over the prior cycle.
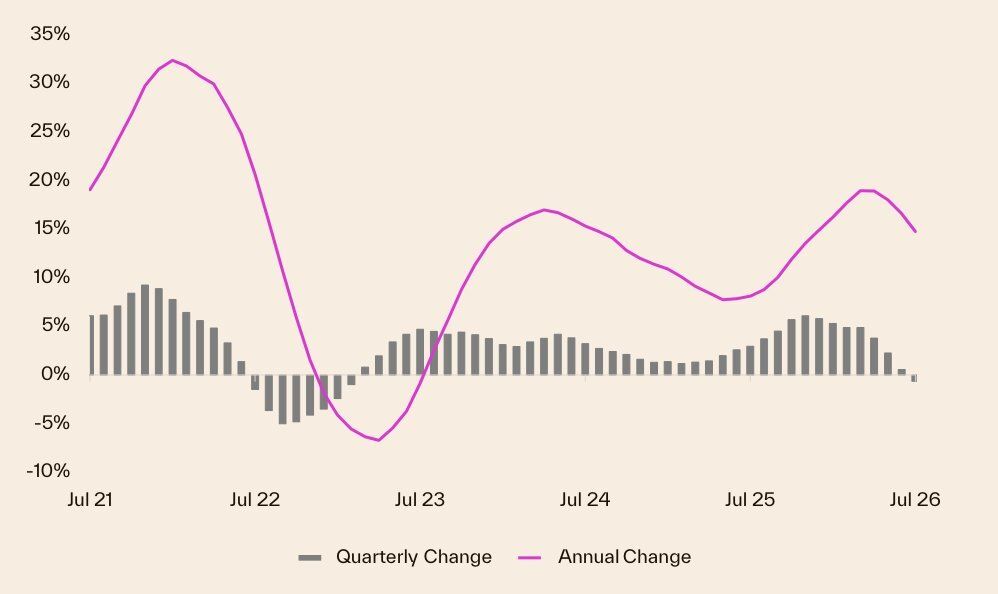
The five-year trend was shaped by two distinct forces: a prolonged period of strong demand, driven by interstate migration and constrained housing supply, that pushed values sharply higher through 2022 to early 2026, followed by a change in conditions as the cash rate held at 4.35 per cent and total listings across the city grew well above year-ago levels. More properties sitting on market for longer, combined with buyers facing elevated borrowing costs, has been enough to tip the short-term trend lower even as the longer-run gains remain intact.
Brisbane property 30 year property price graph
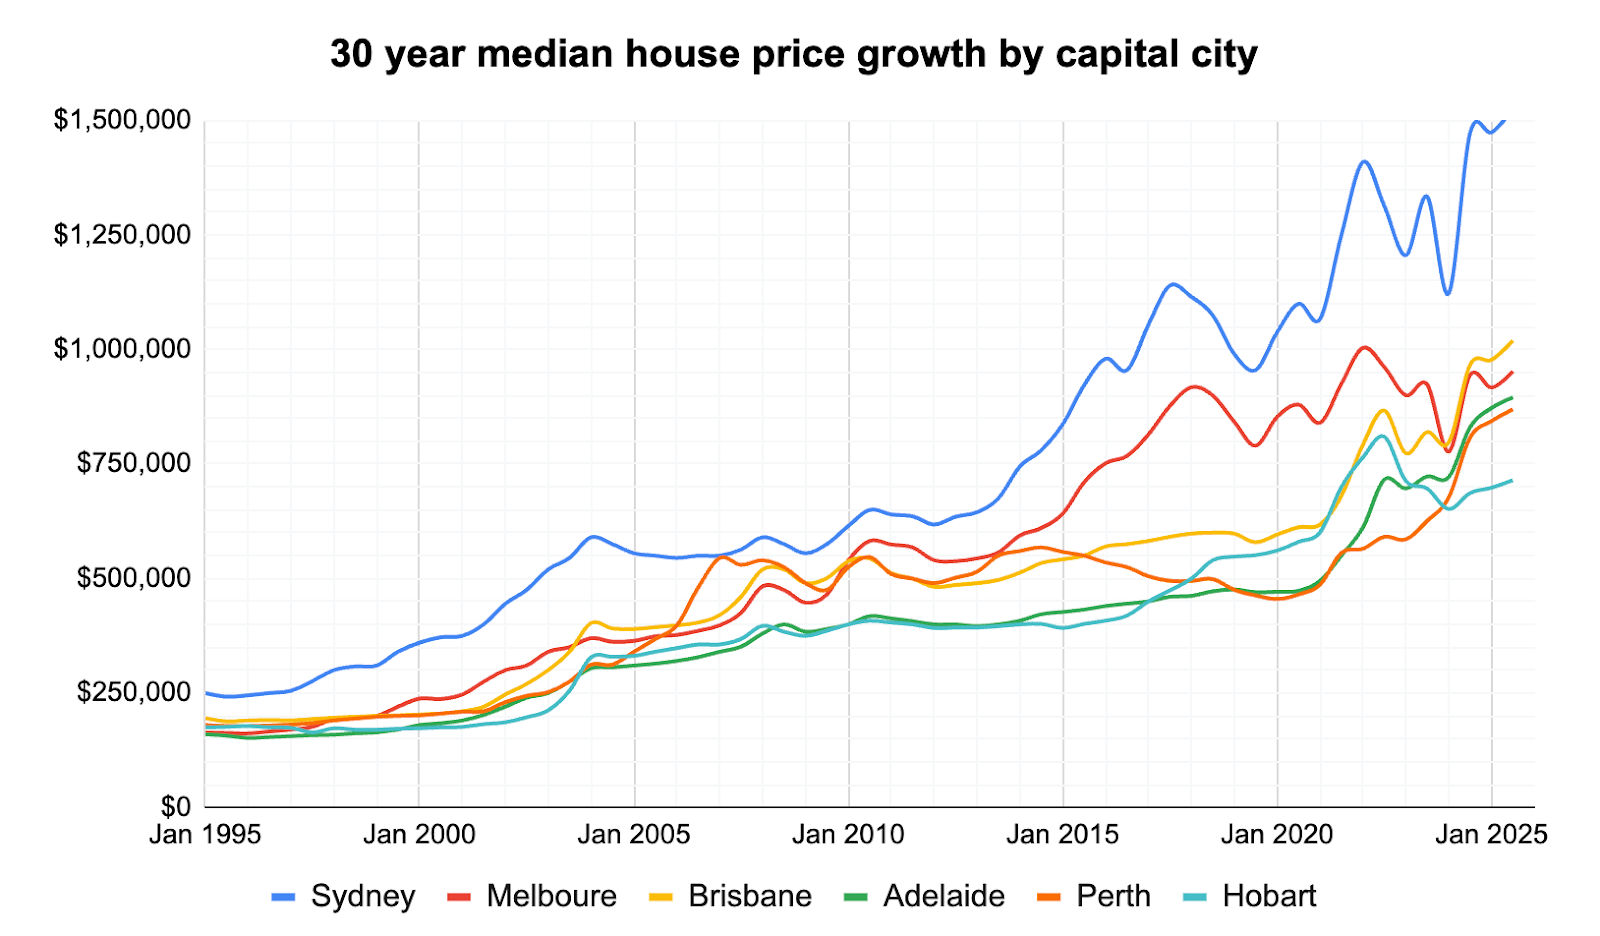
Brisbane property prices growth over the last 10 years has been pronounced, with the city moving from a traditionally affordable capital to one where median house values climbed sharply into the million‑dollar range by late 2025, reflecting years of strong demand and constrained supply. Historical research for Brisbane shows that over the past three decades, low interest rates, sustained population gains and limited new housing have been the main drivers of this long‑run appreciation.
Over the last 30 years, Brisbane has seen repeated cycles of rapid gains and shorter corrections, leaving many homeowners with substantial paper equity while making entry much harder for new buyers. Today, sentiment is mixed: existing owners feel wealthier and are reluctant to sell, while buyers — especially first‑timers — are more cautious because of high prices and elevated mortgage costs; at the same time, tight rental markets and the lead-up to the 2032 Olympics are keeping long‑term confidence relatively strong.
Brisbane selling statistics
Selling conditions in Brisbane have shifted noticeably over the past year. More stock is sitting on the market, homes are taking longer to find buyers, and sellers are accepting larger discounts to close a sale than they were twelve months ago.
Want to know what your own property is worth? Get a free value estimate for your address.
Brisbane sales volume and days on market
Brisbane sales volume fell -7.2 per cent year on year in July 2026, a steeper drop than both the combined capitals average of -3.5 per cent and the national figure of -0.8 per cent. At the same time, the median days on market stretched from 19 days a year ago to 28 days. That pace of lengthening is notable, even against a national backdrop where selling times have also extended.
| Brisbane sales volume | Brisbane days on market |
|---|---|
| -7.2% Change from 12mo ago | 28 days 19 days 12mo ago |
Source: Cotality
Brisbane's 28-day median sits below both the combined capitals figure of 33 days and the national median of 35 days, so homes here are still selling faster than the broader average. That gap has narrowed considerably from a year ago, suggesting Brisbane's relative advantage as a quick-sale market is compressing.
Brisbane new and total listings
New listings in Brisbane climbed +12.7 per cent year on year, while total listings rose a much sharper +39.5 per cent over the same period. When new supply grows modestly but total stock surges, the gap is typically explained by properties lingering on the market rather than a flood of fresh vendors, and that pattern is playing out here.
| Brisbane new listings | Brisbane total listings |
|---|---|
| +12.7% Change from 12mo ago | +39.5% Change from 12mo ago |
Source: Cotality
The near-40 per cent lift in total listings gives buyers considerably more choice than they had a year ago. For sellers, that means more competing properties on the street when pricing and presenting, and less urgency from buyers to act quickly. The step-up in listings is part of the same story as the rise in days on market and the wider vendor discounts recorded below.
Brisbane vendor discount and auction clearance rates
Vendor discount measures the gap between what a seller initially asks and what they ultimately accept, expressed as a percentage of the asking price. Auction clearance rates record the share of properties that sell on auction day or shortly after. Taken together, they give a read on how much sellers are adjusting their expectations and how competitive buyers are at the point of sale.
Brisbane vendor discount
| July 2026 | July 2025 | |
|---|---|---|
| Brisbane median vendor discount | -3.7% | -2.9% |
Source: Cotality
Brisbane's vendor discount widened from -2.9 per cent a year ago to -3.7 per cent in the most recent period. That 0.8 percentage point shift means sellers are, on average, accepting offers further below their initial asking price than they were twelve months ago, consistent with more stock on market and longer selling times.
Brisbane auction clearance rates
| Brisbane | 16 Aug 2026 |
|---|---|
| Total Auctions | 145 |
| Sold | 41 |
| Withdrawn | 10 |
| Passed in | 28 |
| 76 | 51.9% |
Source: Cotality
For the week ending 16 August 2026, Brisbane recorded a clearance rate of 51.9 per cent from 79 reported results, with 41 properties sold and 28 passed in. A rate just above 50 per cent sits well below the long-run balanced-market range of 65 to 70 per cent, placing current conditions clearly in buyer-favourable territory where demand at auction is not keeping pace with supply.
Thinking of selling? Compare top-performing local agents in your suburb to find the right fit for your sale.
Get a deeper insight into how Brisbane sellers are faring in 2026 and what could be on the horizon for the year ahead with some of our latest articles.




Brisbane property investing
Brisbane's rental market continues to put pressure on tenants while offering investors steady income returns, even as property values ease from their May 2026 peak. Rents are climbing faster in Brisbane than in most other capital cities, and vacant properties remain scarce.
Helpful resource: Estimate the capital gains tax on a sale with our free calculator.
Brisbane rental market
The table below sets out Brisbane's annual rent growth, gross rental yield, and the breakdown between houses and units, alongside the same figures for other capital cities and the national aggregates.
| Location | Rental rates | Rental yield | Annual change in rents, houses | Annual change in rents, units |
|---|---|---|---|---|
| National | 5.9% | 3.7% | NA | NA |
| Combined Capitals | 5.9% | 3.6% | NA | NA |
| Combined Regional | 5.9% | 4.2% | NA | NA |
| Sydney | 5.5% | 3.3% | 6.1% | 4.4% |
| Melbourne | 5.1% | 4.0% | 5.2% | 4.9% |
| Brisbane | 6.6% | 3.4% | 6.7% | 6.2% |
| Adelaide | 5.3% | 3.5% | 5.4% | 5.0% |
| Perth | 8.1% | 3.8% | 8.1% | 7.8% |
| Hobart | 8.0% | 4.3% | 8.3% | 6.9% |
| Darwin | 10.4% | 6.2% | 11.1% | 9.4% |
| Canberra | 3.3% | 4.2% | 4.0% | 1.5% |
Source: Cotality
Brisbane's rents rose +6.6 per cent over the year to July 2026, ahead of the combined capitals average of +5.9 per cent and the second-fastest rate among the southern capitals. Both houses (+6.7 per cent) and units (+6.2 per cent) are running at a similar pace, which means the rental pressure is spread across property types rather than concentrated in one segment. At 3.4 per cent, Brisbane's gross yield sits just above Sydney's 3.3 per cent and below the combined capitals average of 3.6 per cent, reflecting how strongly values have grown relative to rents over the past few years.
Brisbane vacancy rates
Vacancy rates measure how many rental properties sit empty at any given time, and a low rate generally signals strong competition among tenants for available homes. SQM data shows that Brisbane's vacancy rate has held at 0.9 per cent, essentially unchanged from 0.9 per cent a year ago.
| Location | June 2026 vacancy rates | June 2026 vacancies | June 2025 vacancy rates | June 2025 vacancies |
|---|---|---|---|---|
| National | 1.3% | 39,229 | 1.3% | 39,027 |
| Sydney | 1.6% | 11,957 | 1.6% | 11,482 |
| Melbourne | 1.6% | 8,640 | 1.8% | 9,414 |
| Brisbane | 0.9% | 3,065 | 0.9% | 3,147 |
| Adelaide | 0.7% | 1,096 | 0.8% | 1,268 |
| Perth | 0.6% | 1,247 | 0.8% | 1,457 |
| Hobart | 0.7% | 185 | 0.6% | 175 |
| Darwin | 0.3% | 64 | 0.5% | 115 |
| Canberra | 1.7% | 1,063 | 1.5% | 920 |
Source: SQM Research
Brisbane's vacancy rate is essentially flat on a year ago, sitting at 0.9 per cent with 3,065 vacant properties compared with 3,147 twelve months earlier. That reading is well below the national rate of 1.3 per cent, and well below Sydney and Melbourne, both at 1.6 per cent. At this level, renters in Brisbane have very little choice among available properties, and that limited supply is a key driver of the sustained rent growth the city has recorded.
Louis Christopher, Managing Director at SQM Research said in the latest rental market report:
"While the national vacancy rate has edged up to 1.3%, Australia's rental market remains exceptionally tight by historical standards. Most capital cities continue to record vacancy rates below one per cent or only marginally above, highlighting that rental supply remains insufficient to meet demand."
Mr Christopher's observation applies directly to Brisbane. With a vacancy rate of 0.9 per cent, the city sits firmly among the capitals where supply has not kept pace with demand, and that gap is what has kept rental growth running at more than twice the rate of general inflation. For investors, the income outlook remains supported by that structural constraint, even as the yield figure reflects the scale of value growth Brisbane has seen over recent years.
Highest growth areas in Brisbane
Brisbane's strongest annual price gains in July 2026 came from a broad sweep of outer suburban and fringe regions spread across the city's south, west and north. The table below ranks the top 10 Statistical Area Level 3 (SA3) regions across Greater Brisbane by annual percentage change, an SA3 is an ABS geographic classification that typically groups several adjacent suburbs into a single region for statistical purposes.
| Rank | SA3 Name | SA4 Name | Median Value | Annual % Change |
|---|---|---|---|---|
| 1 | Beaudesert | Logan - Beaudesert | $933,746 | +20.8% |
| 2 | Sherwood - Indooroopilly | West | $1,281,099 | +20.4% |
| 3 | Beenleigh | Logan - Beaudesert | $927,245 | +19.4% |
| 4 | Nundah | North | $1,216,889 | +18.8% |
| 5 | Springwood - Kingston | Logan - Beaudesert | $922,492 | +18.7% |
| 6 | Forest Lake - Oxley | Ipswich | $1,012,441 | +18.6% |
| 7 | Loganlea - Carbrook | Logan - Beaudesert | $1,003,001 | +18.2% |
| 8 | Caboolture | Moreton Bay - North | $956,142 | +18.1% |
| 9 | Sandgate | North | $1,141,245 | +17.9% |
| 10 | Springfield - Redbank | Ipswich | $958,532 | +17.8% |
Source: Cotality
Highlights for Brisbane's high growth areas
- Beaudesert: Ranked #1 with annual growth of +20.8 per cent and a median value of $933,746, Beaudesert leads all Brisbane SA3 regions for the year to July 2026. Its position at the outer fringe of the Logan corridor, combined with a median well below the city-wide figure, points to buyers seeking more land and lower entry costs than the inner and middle rings can offer.
- Sherwood - Indooroopilly: Ranked #2 with +20.4 per cent annual growth and a median of $1,281,099, this western inner-ring region has posted standout gains despite already carrying one of the higher medians among the top 10. Suburbs such as Indooroopilly and Taringa continue to attract buyers drawn to proximity to the CBD, riverside amenity and access to quality schooling.
- Beenleigh: Ranked #3 with +19.4 per cent annual growth and a median of $927,245, Beenleigh sits in the Logan - Beaudesert SA4 and represents one of the more accessible entry points into the Brisbane market. Suburbs such as Beenleigh and Eagleby have drawn buyers pushed south along the corridor by rising prices closer to the city.
- Outer south and north affordability band: Ranks #4 through #6, Nundah (+18.8 per cent, $1,216,889), Springwood - Kingston (+18.7 per cent, $922,492) and Forest Lake - Oxley (+18.6 per cent, $1,012,441), span both sides of the city, suggesting broad-based demand rather than a single directional trend. Nundah, in Brisbane's north, includes suburbs such as Nundah and Boondall; Forest Lake - Oxley in the south-west counts Forest Lake and Oxley among its key suburbs.
- Logan and outer Moreton Bay corridor: Ranks #7 through #10, Loganlea - Carbrook (+18.2 per cent, $1,003,001), Caboolture (+18.1 per cent, $956,142), Sandgate (+17.9 per cent, $1,141,245) and Springfield - Redbank (+17.8 per cent, $958,532), complete the top 10, with suburbs such as Shailer Park in Loganlea - Carbrook and Redbank Plains in Springfield - Redbank among the more active pockets. The cluster of medians sitting between $922,000 and $1,003,000 across these four regions reflects a consistent affordability profile that has sustained buyer interest across Brisbane's outer ring.
Thinking of selling or investing in Brisbane? Compare local agents or get a free property report with OpenAgent.
View agent & property tools

Our powerful property tools


 - https://sketch.com --%3e %3ctitle%3eicons / icon-chevron-down%3c/title%3e %3cdesc%3eCreated with Sketch.%3c/desc%3e %3cg id='icons-/-icon-chevron-down' stroke='none' stroke-width='1' fill='none' fill-rule='evenodd'%3e %3crect id='Icon-container' x='0' y='0' width='24' height='24'%3e%3c/rect%3e %3cpolygon id='Shape' fill='%2300AB55' points='12 14.3357864 5.20710678 7.54289322 3.79289322 8.95710678 12 17.1642136 20.2071068 8.95710678 18.7928932 7.54289322'%3e%3c/polygon%3e %3c/g%3e%3c/svg%3e)