Some markets surge, others pull back in November property shakeup

For months now we've seen a similar story playing out in the Australian property market: steady growth across most of the country with hints that things might be about to turn a corner.
According to the data in CoreLogic's latest home value index report, we've seen that shift occur throughout November, and it may not be what you expected.
So which markets are soaring ahead and which are beginning to drag behind?

National property values: November 2021
| Houses | Units |
|---|---|
| $750,096 | $599,069 |
| Monthly change: +1.4% | Monthly change: +0.9% |
November's +1.3 per cent rise in the national median dwelling value is the smallest monthly increase since January this year, but it's still pushed the price of the median Australian home to within striking distance of $700,000.
That only tells part of the story, though, as there have been some significant changes to the growth patterns we've been seeing.
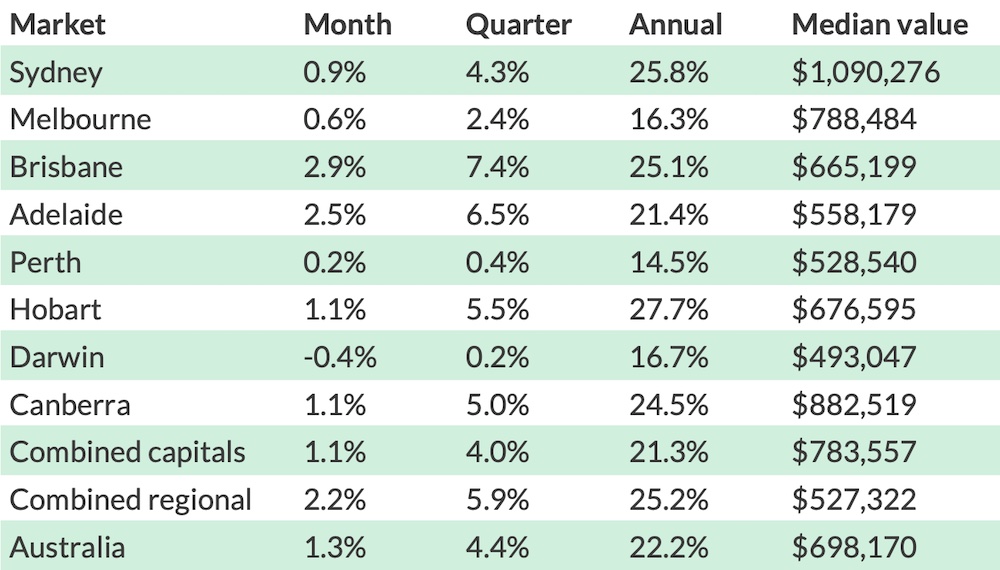
Sydney, Hobart and Canberra, three of the country's most explosive markets throughout the 2021 boom, have all posted far softer monthly increases around the +1.0 per cent mark.
Melbourne has also dipped down to +0.6 per cent growth for November, and Darwin and Perth have continued to stagnate after both experiencing strong boom conditions in the first half of the year.
Brisbane and Adelaide, meanwhile, have managed to find a new top gear, with both cities delivering their highest monthly rates of growth for 2021.
Adelaide's median price jumped up by +2.5 per cent, equating to around $13,500, while Brisbane surged an incredible +2.9 per cent. That's $18,500 up for the month or $615 per day.
CoreLogic's research director Tim Lawless explains that "relative to the larger cities, housing affordability [in Brisbane and Adelaide] is less pressing, there have been fewer disruptions from Covid lockdowns and a positive rate of interstate migration is fueling housing demand."
It all takes national annual growth up to +22.2 per cent, meaning the median Australian property has gained around $126,700 in value over the past year.

Regional growth is accelerating again while capitals trend downwards
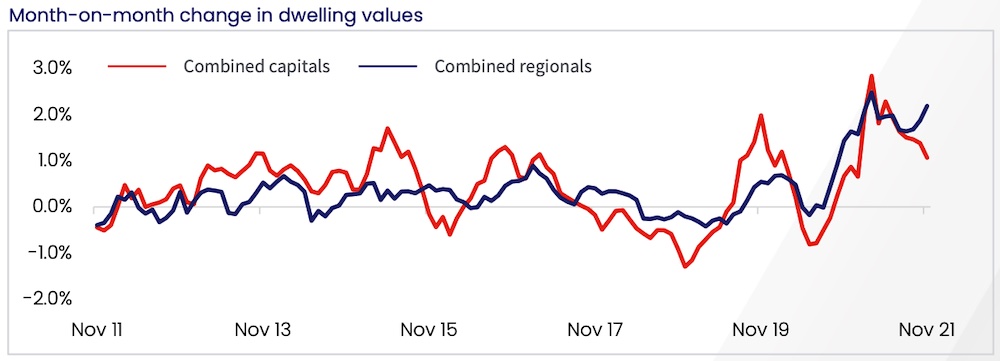
While it's been a mixed bag in the capitals, regional markets have performed strongly across the board in November.
Regional NSW, QLD, SA and Tasmania were all comfortably above +2.0 per cent growth in November, with Victoria and WA posting solid +1.8 and +1.3 per cent gains respectively.
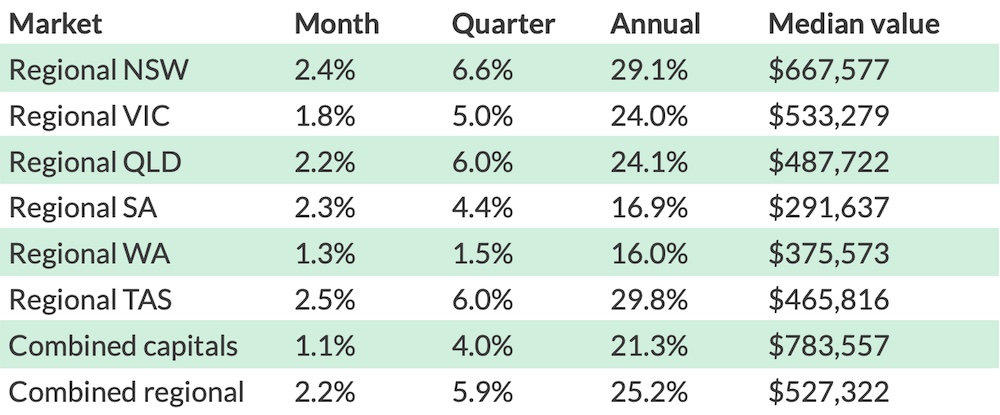
Those figures seem to be definitively answering the question as to whether the regional trend towards a sea or tree change could be drying up post-lockdowns. As a whole, growth in the capitals is heading south, while in the regions it's ramping back up.
CoreLogic's report notes that "demand for housing across regional markets, especially those within commuting distance of the major cities, is continuing to benefit from the rise in popularity of remote working arrangements."
It also points to "renewed demand for coastal and lifestyle properties, and in many cases, more affordable housing options."

Stock levels are having a big impact on the rise and decline in growth
One of the key driving factors of this year's boom has been that there simply hasn't been enough supply to satisfy demand, but that dynamic is beginning to change in some markets.
Brisbane and Adelaide are still experiencing severe shortages in stock compared to the five-year average, a key reason why they're seeing accelerating growth, while huge spring selling seasons in Sydney and Melbourne have seen stock returning to more regular levels relative to the average.
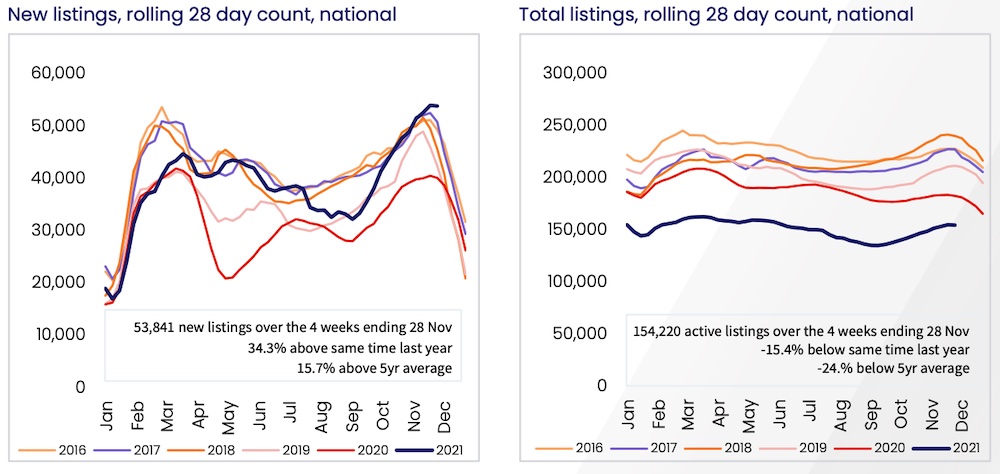
Mr Lawless explains that "fresh listings are being added to the market faster than they can be absorbed, pushing total active listings higher.
"More listings implies more choice and less urgency for buyers."
The last weekend in November saw CoreLogic register the highest number of auctions in Australia since their records began in 2008. As a result, clearance rates dipped down to 71.4 per cent—still a strong result, but not at the high level we've been used to seeing for most of this year.
Even though new listings continue to rise, total stock on the market remains low for now, so there's still a window of opportunity for sellers before supply and demand fully balance out.
"The rise in listings and softening of key vendor metrics implies the housing market may be moving through peak selling conditions, however, it will be important to see if this trend towards higher listings continues after the festive season," Mr Lawless says.
Affordability and rising fixed rates are dictating changes in the market
"Virtually every factor that has driven housing values higher has lost some potency over recent months," Mr Lawless says.
"Fixed mortgage rates are rising, higher listings are taking some urgency away from buyers, affordability has become a more substantial barrier to entry and credit is less available."
The ever-growing affordability issue has been a factor in cooling some of the country's hottest markets in recent months, and it's beginning to push more buyers away from houses and towards units.
The CoreLogic report notes that capital city houses are now +37.9 per cent more expensive than units, the largest difference on record.
In Sydney, for example, the difference between the median house and unit price is a staggering $523,000.
"With such a large value gap between the broad housing types, it's no wonder we are seeing demand gradually transition towards higher density housing options simply because they are substantially more affordable than buying a house," Mr Lawless explains.
What's next for the Australian property market?
Looking at the big picture, there are a number of headwinds that look like they'll continue to temper property price growth in the coming months.
Total listings in most markets are on the rise, helping to ease buyer demand. As a result, CoreLogic points out that "vendors may need to adjust their pricing expectations if homes take longer to sell."
There's been plenty of talk about the RBA raising the cash rate earlier than 2024, and that's been a factor in pushing up the cost of fixed rate mortgages.
Combine that with poor affordability, APRA's tightening of lending conditions and the potential for more of those restrictions to come, and it means buyers with diminished borrowing power will be likely to pay less for property.
On the other hand, there are some positive markers when it comes to future growth. For one thing, the opening of international borders should bring a measurable increase in demand for housing.
Even though interest rates are set to rise, they're still at extremely low levels, and that won't change drastically in the near future. Also, with such a high percentage of Australians now vaccinated, market disruptions caused by Covid are looking less likely.
It's important to remember that every market is different, as is every property. If you're considering selling, speaking to a top agent in your local area is often the best first step towards getting a full picture of what's going on around you and where the market might be heading.