OpenAgent Seller Sentiment Index - 2017 Q3

Here at OpenAgent, we know the importance of up-to-date market insights.
As Australia’s largest real estate comparison and referral platform, we speak to thousands of homeowners every month who are seeking assistance in selecting the right person to sell their largest financial asset.
We’re always looking for ways to add value for our customers, and we realised that by speaking with such a broad range of homeowners all over Australia, we had the unique ability to capture the market perspectives of one of the most important groups in the real estate ecosystem - home sellers.
In November 2016, we began compiling anonymised data capturing the sentiment and market expectations of consumers who were actively looking to sell their property.
This third quarterly release of the Report in October 2017 shows some fascinating developing trends in sentiment, based on a total of over 8,000 responses from property vendors across the last 11 months.
As you’ll see below, this regular report includes home price sentiment at a National, State and Metro level, as well as granular information about why people are selling, and what they see as the key factors driving their local market.
We hope you enjoy this report, and we look forward to delivering many unique insights in the quarters to come.
Sincerely yours,
Zoe & Marta Co-Founders of OpenAgent
How the Seller Sentiment Index Works
To build the Consumer Sentiment Index, we ask our vendors the following question:
Where do you expect home prices to be in your area in six months’ time?
Vendors then rank their answer on a 5 tier scale, ranging from Strongly Up, Slightly Up, About The Same, Slightly Down and Strongly Down. This information is then collated to provide the basis for our proprietary index system.
The index gives a measure of vendors’ expectations for home price movement on a scale of -10 to +10, with a reading of 0 being a neutral view of the market. Values above +5 indicate strong overall optimism and values below -5 indicate strong overall pessimism.
In 2017 Q3, we collected a total of 3,185 survey responses from OpenAgent customers all across Australia. All of our responses have been weighted against the relevant cohorts at the state level to remove any bias and present a realistic snapshot of sentiment for that group.
Using this methodology, we ensure that the Consumer Sentiment Index is relevant for all vendors, not just OpenAgent’s customers.
National Seller Sentiment
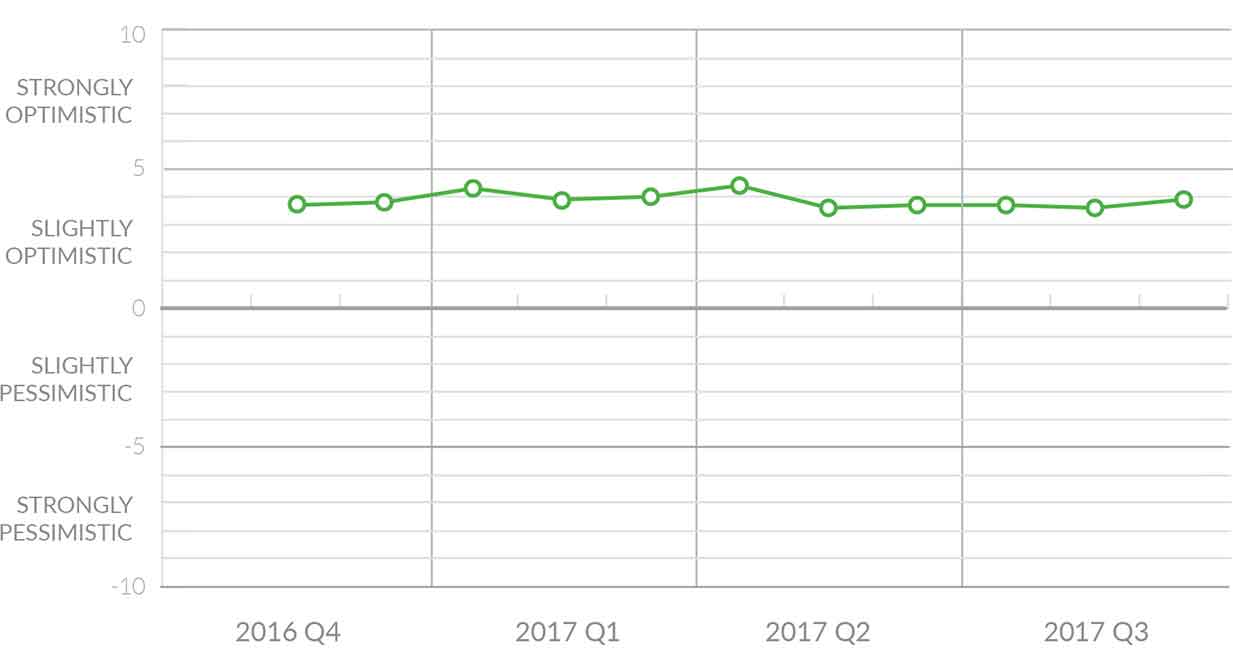
At the national level, a relative low in consumer sentiment appeared in the index from 2017 Q2 into Q3, with readings between +3.6 and +3.7 for four consecutive months. This was down from higher index values of at least +4.0 recorded during January, March, and April 2017. The reading of +3.9 in Sept 2017 was a slight bounce back up as spring arrives across Australia. There is still no sign of a nationwide turn in sentiment in the housing market, although certain regions do show trends as will be explained below.
Home sellers gave a variety of reasons why the prices would move. The most common reason for prices to move up was many people moving into the area (50%) followed by new developments (38%) and the local economy (8%). These splits were very similar to previous quarters. The most common reasons for prices to stay the same or decline were new developments (32%), many people moving in (28%) and state of jobs in the area (26%) followed by many people moving in (25%) and new developments (25%). These splits were also relatively unchanged from the previous quarter.
State Seller Sentiment
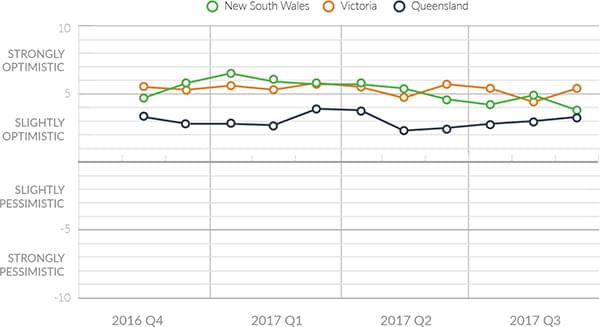
The consumer sentiment index for New South Wales has continued to show a decline since an enthusiasm peak at +6.5 in January 2017. There was some fluctuation in Q3 with values of +4.2 in July, +4.9 in August, and a low +3.8 in September. However there is a clear downward trend in home price expectations in NSW. The perspective of home sellers seems to indicate that the exceptional growth in property prices in NSW seen in recent years is not expected to continue. On the other hand, there is no sign of an outright crash in the index, so slow and steady price growth is the most likely outcome according to sellers.
In Victoria, the consumer sentiment index values have generally hovered around +5.5 during 2017 with an occasional spike downward but no clear trend. This contrasts quite clearly with NSW and likely indicates a real difference in the two markets which had generally moved together over the last few years. The Q3 values of +5.4 in July, +4.4 in August, and +5.4 in September indicate sustained positive expectations in VIC which don’t seem to be changing anytime soon.
The consumer sentiment in Queensland is following quite a different pattern to the two larger states. After a deep drop in Q2 to a low of +2.3 in May, the index has very slowly recovered month by month to values of +2.8 in July, +3.0 in August, and +3.3 in September. The contrast with NSW and VIC is quite interesting, showing that the east coast real estate markets don’t necessarily operate in parallel. If trends continue, NSW may soon have weaker sentiment than QLD or VIC, a situation quite opposite of the last few years.
Metro vs. Regional Seller Sentiment
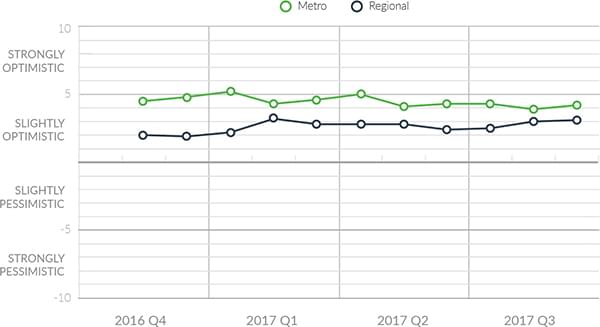
Although metro areas have generally had more positive consumer sentiment than regional areas, the lastest quarter suggests the gap may be closing. Metro areas collectively had a step down in sentiment in Q2 and the index level has stayed flat in Q3. With values of +4.3 in July, +3.9 in August, and +4.2 in September, there is certainly no cause for concern, but the index is clearly lower than monthly values at or above +5 seen earlier in 2017.
On the other hand, regional areas which together had sagging sentiment through 2017 Q2 have recovered somewhat to values of +2.5 in July, +3.0 in August, and +3.1 in September. It would seem that there is enough strength in regional markets to produce expectations of price growth, despite challenges from commodities industries. The gap between sentiment index values in metros versus regional areas has shrunk from 3 points in January 2017 to under 1 point in August. It is possible that some of the property activity, by both owner-occupiers and investors, has shifted out of the metros to the rest of Australia.
Capital Cities
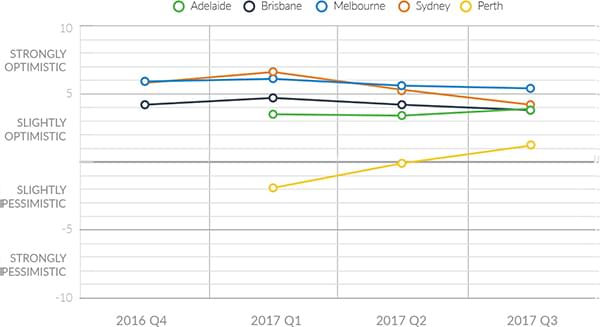
The diverging states of the markets around Australia are well highlighted by the capital city sentiment index values, with Melbourne now the clear winner on price growth expectation at +5.4. Sydney, with a value of +4.2, is just above Adelaide on +3.9 and Brisbane on +3.8. Perth still has the weakest market of the mainland capitals with an index value of +1.2.
The trends for each capital city index speak volumes about the evolution of their markets. Sydney has come down considerably from a peak of +6.6 in January 2017, while Melbourne has had a more gentle easing off its January peak of +6.1. Brisbane has traced a similar path as Melbourne with a decline from a January peak of +4.8, but Adelaide has actually stepped up over the last quarter in contrast to the larger metros. Finally, the rapidly climbing index values in Perth show that the city has turned a corner from the depths of recent market gloom.
Investors vs. Owner Occupier Seller Sentiment
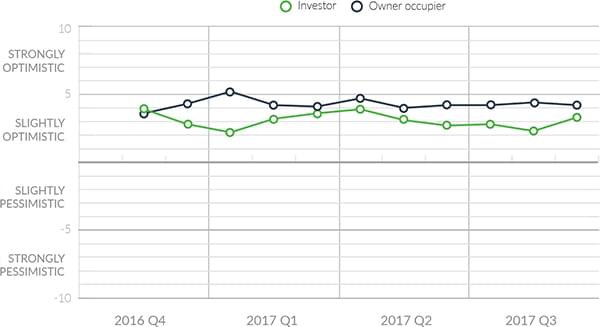
For the duration of the index, owner-occupiers have had noticeably higher sentiment than investors, and that separation continued in 2017 Q3. Owner-occupiers have shown little trend in sentiment during the last three months, with values of +4.2 in July, +4.4 in August, and +4.2 in September. The stability of owner-occupiers’ expectations is good news for the overall market, foretelling that any price crash is not yet at hand.
Investors on the other hand steadily declined in sentiment from a high index value of +3.9 in April 2017 through the rest of Q2 and into Q3. Index values of +2.8 in July and +2.3 in August seemed to indicate that investors were losing their confidence in real estate. However a quarter-ending index value of +3.3 in September has turned that around, narrowing the formerly large gap between investor sentiment and owner-occupiers’ sentiment.