
 - https://sketchapp.com --%3e %3ctitle%3eIcon/search%3c/title%3e %3cdesc%3eCreated with Sketch.%3c/desc%3e %3cg id='Icon/search' stroke='none' stroke-width='1' fill='none' fill-rule='evenodd' stroke-linecap='round' stroke-linejoin='round'%3e %3ccircle id='Oval' stroke='%23252525' cx='10.5145111' cy='10.5145111' r='6.99455261'%3e%3c/circle%3e %3cpath d='M15.4908752%2c15.4908752 L20.5515137%2c20.5515137' id='Line' stroke='%23252525'%3e%3c/path%3e %3c/g%3e%3c/svg%3e)

Melbourne property market news - key takeaways
- Price growth continues: Melbourne has seen its eighth consecutive month of growth in September 2025, with a +0.5 per cent increase. Even with these steady gains, the Melbourne property market is still trailing behind the combined capitals benchmark of +0.9 per cent, as per Cotality’s latest figures.
- Supply and demand dynamics: According to Cotality data, Melbourne is facing a persistent supply shortage, with listings well below the five-year average. This imbalance is pushing prices upward.
- Auction market activity: Domain data shows Melbourne's auction clearance rate was 72 per cent for the week of October 5, 2025. This indicates strong buyer interest and competitive market conditions.
- Rental market remains tight: SQM Research highlights that Melbourne's rental market is tight, with a vacancy rate of just 1.8 per cent. Weekly rents have increased, reflecting ongoing demand pressures.
- Interest rates on hold: The RBA has kept the cash rate steady at 3.60 per cent. Major banks are not expecting any cuts in 2025, which should maintain current borrowing capacities and market conditions.

Get a free property value estimate
Find out how much your property is worth in today’s market.
Melbourne property price movements
The Melbourne property market is on a steady climb, marking its eighth month of rising dwelling values. However, it still lags behind other major capitals due to affordability issues and a cautious lending climate.
Melbourne property prices - September 2025
In September 2025, Melbourne's property prices edged up by +0.5 per cent monthly. This contributed to a quarterly rise of +1.0 per cent and an annual increase of +1.9 per cent. The median property value in Melbourne now stands at $805,880.
| Property type | Month change (Sep 25) | Quarter change (Sep 25) | Annual change (Sep 25) | Current median price (Sep 25) |
|---|---|---|---|---|
| All Melbourne dwellings | 0.5% | 1.0% | 1.9% | $805,880 |
Source: Cotality
The market is buoyed by better borrowing capacity and improved consumer sentiment, thanks to lower interest rates and real wage growth. Yet, Melbourne's growth pace is still below the combined capitals benchmark, pointing to a more measured recovery.
House prices in Melbourne
Melbourne house prices rose by +0.5 per cent in September 2025, with quarterly gains of +1.0 per cent and an annual rise of +2.5 per cent. The median house price in Melbourne is now $953,454.
| Property type | Month change (Sep 25) | Quarter change (Sep 25) | Annual change (Sep 25) | Current median price (Sep 25) |
|---|---|---|---|---|
| Melbourne houses | 0.5% | 1.0% | 2.5% | $953,454 |
Source: Cotality
The Melbourne housing market is showing stability with consistent monthly gains. However, it faces challenges from affordability issues and high household debt levels. Despite these hurdles, Melbourne house prices are gradually aligning with broader national trends.
Unit prices in Melbourne
Unit prices in Melbourne increased by +0.6 per cent in September 2025, with a quarterly rise of +0.8 per cent and a modest annual increase of +0.2 per cent. The median value for units in Melbourne is $628,979.
| Property type | Month change (Sep 25) | Quarter change (Sep 25) | Annual change (Sep 25) | Current median price (Sep 25) |
|---|---|---|---|---|
| Melbourne units | 0.6% | 0.8% | 0.2% | $628,979 |
Source: Cotality
The Melbourne unit market is growing at a slower pace compared to houses, reflecting broader trends in Melbourne unit prices. Investor participation remains cautious, influenced by rental yields and vacancy trends. Despite these factors, the unit market is set for gradual improvement as borrowing conditions stabilise.
Melbourne property market forecasts 2025-2026
Australia's big four banks regularly release house price forecasts to aid in mortgage-lending decisions, manage risk, and demonstrate their market expertise. Here's what we can expect for 2025 and 2026.
| Market | CBA forecast 2026 | Westpac forecast 2026 | NAB forecast 2026 | ANZ forecast 2026 |
|---|---|---|---|---|
| National | 4.0% | 4.0% | 4.1% | 5.8%* |
| Sydney | 3.0% | 5.0% | 4.2% | 5.3% |
| Melbourne | 2.0% | 3.5% | 3.9% | 6.2% |
| Brisbane | 5.0% | 4.5% | 4.6% | 4.3% |
| Adelaide | 5.0% | 3.0% | 4.1% | 2.5% |
| Perth | 6.0% | 4.0% | 3.7% | 4.3% |
| Hobart | 2.0% | 2.0% | 3.6% | 1.8% |
Source: Westpac Housing Pulse, NAB Residential Property Survey, CBA Economic Update, ANZ Housing Outlook. No prediction data for Canberra or Darwin.
* ANZ estimate for Capital Cities, not national
Melbourne is expected to see moderate growth compared to other major cities, with predictions pointing to a steady rise in house prices. These Melbourne property market predictions suggest a balanced market, where affordability continues to play a crucial role in driving growth.
Melbourne home price forecasts 2026
Westpac anticipates a +3.5 per cent increase in Melbourne's property prices by 2026, while NAB forecasts a +3.9 per cent rise. ANZ is more optimistic, predicting a +6.2 per cent growth.
These forecasts reflect the banks' expectations of a stable economic environment and the impact of earlier cash rate cuts, which have improved borrowing conditions. However, Melbourne's growth is expected to be slower compared to other cities due to its gradual recovery and cautious investor sentiment.
RBA cash rate forecast 2025-2026
The RBA held the cash rate at 3.60 per cent in its late-September meeting. The focus now is on whether the Board will make a move before the year ends or wait until early 2026. The current discussion revolves around the next CPI print and signs of easing in services inflation and wage growth, amidst a tight rental market and resilient job sector.
The four major banks have updated their views, mostly agreeing on "no further 2025 cuts," with one notable exception:
- CBA: No further move in 2025; a -0.25 percentage point cut in February 2026, bringing the cash rate to 3.35 per cent by early 2026.
- Westpac: Expects a -0.25 percentage point cut in November 2025, followed by two more in February and May 2026, reducing the cash rate to 2.85 per cent by mid-2026.
- NAB: No further move in 2025; a -0.25 percentage point cut in May 2026, lowering the cash rate to 3.35 per cent by mid-2026.
- ANZ: No further move in 2025; a -0.25 percentage point cut in February 2026, bringing the cash rate to 3.35 per cent by early 2026.
What this means for the Melbourne market
Melbourne's recovery has been slower and more uneven than Sydney's. Holding the rate through the rest of 2025 likely means price growth remains modest. Investor interest is sensitive to rental yields and vacancy trends; with yields still below those in Perth and Brisbane, and new-build costs high, buyers remain cautious.
Earlier rate cuts have stabilised borrowing power, but a clear demand increase may require either a November cut (as Westpac suggests) or the anticipated February 2026 move (as CBA and ANZ predict). Expect the inner-north and family-sized townhouses to outperform apartments with higher owners-corp fees. Cotality’s latest city league tables still place Melbourne mid-pack in terms of momentum.
Melbourne house prices graphs and charts
Melbourne's house price growth over the last 5 years has seen its ups and downs. The latest figures show a +0.5 per cent rise in September 2025. Over the rolling quarter to September, there was a +1.0 per cent increase, while the annual change to September was +1.9 per cent. Despite these gains, values remain -2.7 per cent below their March 2022 peak.
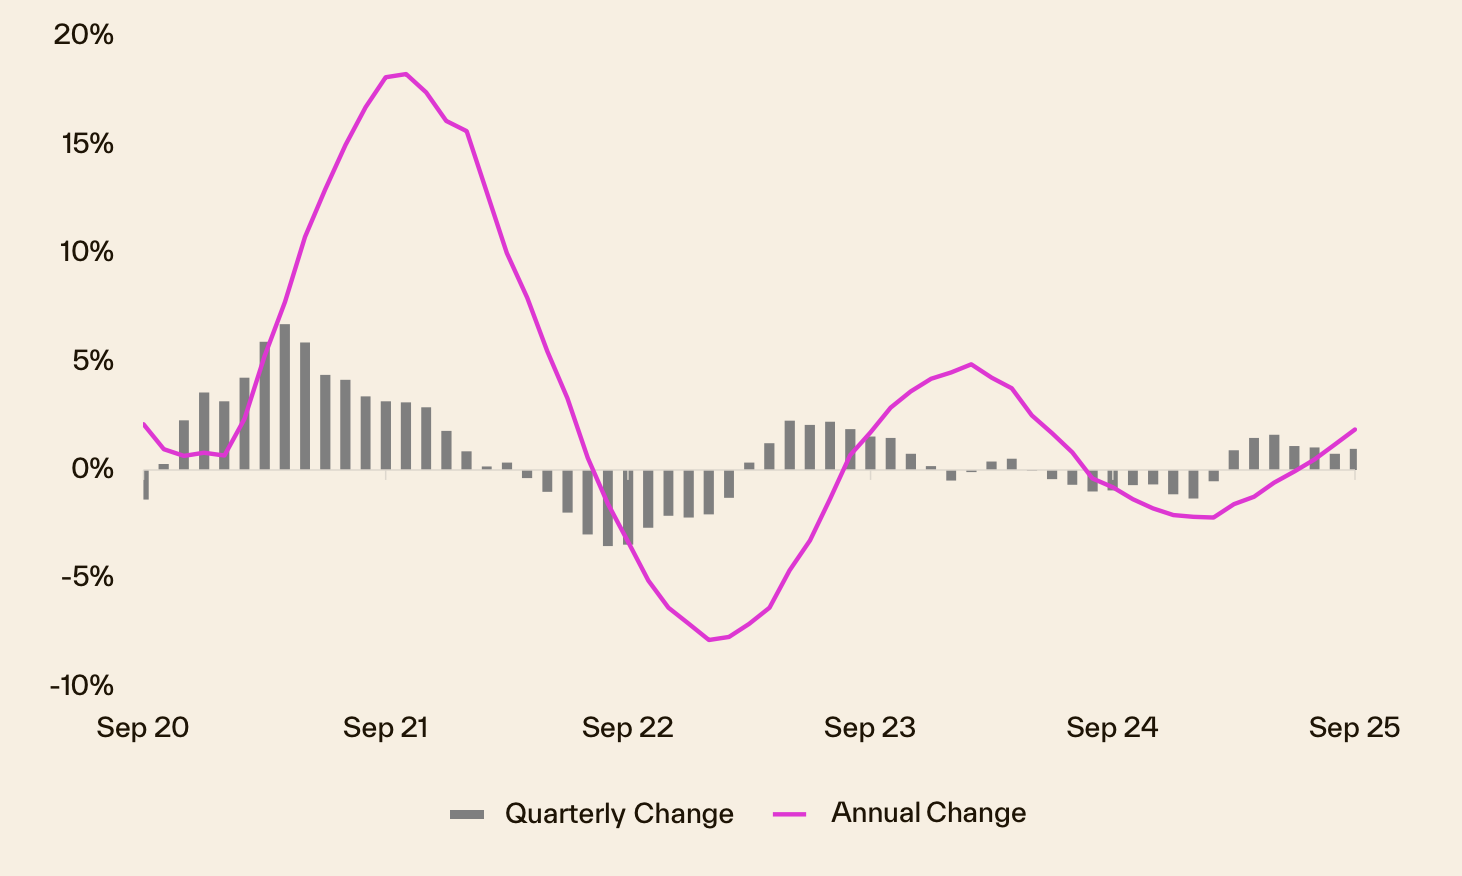
Cotality's analysis indicates that Melbourne's market has followed a "boom-slump-stabilise" pattern over the past five years. Although there was a slight lift in 2025, Melbourne's recovery has been slower compared to cities like Brisbane and Perth. Investor caution and affordability issues have dampened demand.
Melbourne property prices graph over 30 years

Melbourne property growth over the last 10 years has been shaped by several key factors. There was a significant upswing from 2013 to 2017 driven by investor activity and migration, followed by a downturn due to a credit squeeze from 2017 to 2019. The market then experienced a boom from 2019 to 2021, driven by low interest rates and increased demand during the pandemic.
Over the past three decades, Melbourne has seen cycles of growth and correction. The current market is influenced by recent rate cuts and strong population growth. Homeowners today are cautiously optimistic, buoyed by early signs of recovery and a stabilising market. However, buyer sentiment remains cautious due to the lingering effects of the 2022 downturn and ongoing economic uncertainties.
Melbourne selling statistics
Melbourne's property market in October 2025 is buzzing with activity, showing varied trends across different metrics. The data highlights shifts in sales volumes, days on market, and vendor discounting, all reflecting the broader economic conditions and buyer sentiment in the city.
Melbourne sales volume and days on market
In October 2025, Melbourne saw a significant boost in sales volume, with an +8.0 per cent rise compared to the previous year. The median days on market for properties in Melbourne was 32 days, down from 35 days the previous year.
| Melbourne sales volume | Melbourne days on market |
|---|---|
| 8.0% Change from 12mo ago | 32 days 35 days 12 mo ago |
Source: Cotality
This increase in sales volume points to strong demand for properties in Melbourne, contrasting with the national trend where the median days on market have risen to 30 days. Melbourne's quicker turnover compared to cities like Sydney, which has a median of 33 days, indicates a more competitive market where buyers are acting swiftly.
Melbourne new and total listings
Data for September 2025 shows a slight increase in new listings in Melbourne by +1.2 per cent from the previous year, while total listings have decreased by -15.6 per cent.
| Melbourne new listings | Melbourne total listings |
|---|---|
| 1.2% Change from 12mo ago | -15.6% Change from 12mo ago |
Source: Cotality
This scenario of rising new listings but a significant drop in total listings suggests that while more properties are entering the market, they are being snapped up quickly. This could be due to high buyer demand or limited stock, pushing buyers to act faster when new properties become available.
Melbourne vendor discount and auction clearance rates
Vendor discounting measures the percentage difference between the original asking price and the eventual sale price, while auction clearance rates track the share of scheduled auctions that sell under the hammer or immediately after. Together, they reveal how much negotiating power buyers hold and how confidently homes are selling.
Melbourne vendor discount
| Sept 2025 | Aug 2025 | Jul 2025 | Jun 2025 | |
|---|---|---|---|---|
| Melbourne median vendor discount | -3.0% | -3.1% | -3.2% | -3.2% |
Source: Cotality
The vendor discount in Melbourne has tightened to -3.0 per cent over the three months to September 2025, slightly below the national average of -3.2 per cent. This indicates that sellers in Melbourne are conceding less on their asking prices, suggesting a strong demand environment where buyers have less room to negotiate.
Melbourne auction clearance rates
| Melbourne | October 5 | Sept 28 | Sept 21 | Sept 14 |
|---|---|---|---|---|
| Clearance Rate | 72% | 66% | 72% | 71% |
| Auctions Scheduled | 1202 | 1086 | 267 | 1254 |
| Auctions Reported | 939 | 963 | 222 | 1117 |
| Sold | 677 | 638 | 160 | 796 |
| Withdrawn | 71 | 60 | 20 | 68 |
| Passed in | 191 | 265 | 42 | 253 |
Source: Domain
Auction clearance rates in Melbourne for the week of October 5, 2025, stood at 72 per cent, reflecting strong market sentiment. This rate is higher than other capitals like Brisbane and Adelaide, indicating a healthier auction market in Melbourne. The consistent clearance rates suggest that buyers are willing to meet sellers' expectations, reinforcing the city's competitive market conditions.
Get a deeper insight into how Melbourne sellers are faring in 2025 and what could be on the horizon for the year ahead with some of our latest articles.


Melbourne property investing
Melbourne's rental market is currently stable, showing both easing pressures and ongoing demand. Although rental growth has slowed compared to previous years, the market remains balanced, indicating a steady relationship between supply and demand. Let's dive into the statistics on rental rates, yields, and vacancy trends to gain a clearer picture of Melbourne's rental scene.
Melbourne rental market
Rental rates in Melbourne have seen slight annual increases, with the city experiencing one of the slower growth rates among the capitals. Gross rental yields in Melbourne are stable, suggesting that housing values are well-aligned with rental income. These trends set the stage for the detailed metrics below.
| Location | Rental rates | Rental yield | Annual change in rents, houses | Annual change in rents, units |
|---|---|---|---|---|
| National | 4.30% | 3.70% | NA | NA |
| Combined Capitals | 3.70% | 3.40% | NA | NA |
| Combined Regional | 5.90% | 4.40% | NA | NA |
| Sydney | 3.50% | 3.00% | 3.00% | 4.40% |
| Melbourne | 1.40% | 3.70% | 1.20% | 1.80% |
| Brisbane | 5.60% | 3.60% | 5.40% | 6.40% |
| Adelaide | 3.90% | 3.60% | 3.90% | 4.10% |
| Perth | 5.60% | 4.20% | 5.40% | 7.00% |
| Hobart | 6.20% | 4.40% | 6.00% | 6.90% |
| Darwin | 7.60% | 6.50% | 6.80% | 8.90% |
| Canberra | 2.80% | 4.00% | 2.60% | 3.40% |
Source: Cotality
Despite the slow growth in rental rates, Melbourne's rental market remains competitive. The city's vacancy rate has stayed at 1.8 per cent, indicating a nearly balanced market. This stability implies that while rent growth has cooled, any limitations on new supply could quickly tighten conditions.
Melbourne vacancy rates
Vacancy rates are a key indicator of the rental market's health, showing the balance between supply and demand. Nationally, vacancy rates remain tight, pointing to limited supply and ongoing demand pressures. In Melbourne, the vacancy rate has stabilised, suggesting a market nearing equilibrium.
| Location | Sep 2025 vacancy rates | Sep 2025 vacancies | Sep 2024 vacancy rates | Sep 2024 vacancies |
|---|---|---|---|---|
| National | 1.20% | 36046 | 1.20% | 37932 |
| Sydney | 1.30% | 9617 | 1.60% | 11360 |
| Melbourne | 1.80% | 9407 | 1.70% | 8796 |
| Brisbane | 0.90% | 3329 | 1.10% | 3737 |
| Adelaide | 0.80% | 1207 | 0.60% | 1002 |
| Perth | 0.70% | 1362 | 0.60% | 1119 |
| Hobart | 0.40% | 107 | 0.80% | 215 |
| Darwin | 0.70% | 171 | 1.00% | 267 |
| Canberra | 1.60% | 970 | 2.00% | 1198 |
Source: SQM Research
Melbourne's vacancy rate of 1.8 per cent reflects stabilising conditions, with vacancies slightly up to 9,407 from the previous year. This near-balanced state indicates that while rent growth has softened, the market remains sensitive to supply changes.
Louis Christopher, Managing Director of SQM Research said in his latest rental market report
“The national vacancy rate holding at 1.2% suggests the rental market remains very tight, with little sign of meaningful supply increases. Sydney and Brisbane continue to see strong tenant demand, while Hobart remains at near record-low vacancy levels. Rents are still rising in most capitals, particularly for houses, despite a slight easing in rental growth rates compared to last year. Overall, we are still seeing an undersupplied rental market, although conditions appear to be stabilising in some cities such as Melbourne and Canberra.”
Melbourne's vacancy rate has stabilised at 1.8 per cent, echoing Louis's observation of stabilising conditions. Combined advertised rents dipped -0.1 per cent month-on-month, with houses performing better than units. The softening rent trend alongside a stable vacancy rate suggests Melbourne is close to equilibrium, but any new supply constraints could quickly tighten conditions.
Highest growth areas in Melbourne
| Rank | SA3 Name | SA4 Name | Median Value | Annual % Change |
|---|---|---|---|---|
| 1 | Frankston | Mornington Peninsula | $813,941 | 9.2% |
| 2 | Tullamarine - Broadmeadows | North West | $721,266 | 6.8% |
| 3 | Brimbank | West | $702,147 | 6.5% |
| 4 | Knox | Outer East | $960,201 | 5.8% |
| 5 | Dandenong | South East | $773,031 | 5.2% |
| 6 | Cardinia | South East | $762,600 | 4.6% |
| 7 | Whittlesea - Wallan | North East | $762,060 | 4.6% |
| 8 | Monash | South East | $1,218,970 | 4.3% |
| 9 | Sunbury | North West | $701,657 | 4.1% |
| 10 | Melton - Bacchus Marsh | West | $657,980 | 4.1% |
Source: Cotality
Highlights for Melbourne’s high growth areas
- Frankston tops the list for October 2025 with a median value of $813,941, showing a strong annual growth of +9.2 per cent. The area's popularity is boosted by the upcoming $1.1 billion redevelopment of Frankston Hospital, which will enhance local health services and create job opportunities. (Suburbs to watch: Seaford, Frankston, Frankston South, Frankston North, Carrum Downs, Langwarrin, Skye)
- Tullamarine - Broadmeadows comes in at #2, with a median price of $721,266 and an annual growth of +6.8 per cent. The region benefits from employment growth linked to Melbourne Airport and ongoing urban renewal plans, driving demand. (Suburbs to watch: Craigieburn. Mickleham, Kalkallo)
- Brimbank is ranked #3, with a median value of $702,147 and an annual growth of +6.5 per cent. The area is experiencing infrastructural improvements, such as the Sunshine Station redevelopment, which is set to establish it as a key transport hub. (Suburbs to watch: Deer Park, Taylors Lakes, Keilor Downs, St Albans, Sydenham)
- Knox holds the #4 position, with a median value of $960,201 and growth of +5.8 per cent. This growth is driven by strong community investment in parks and facilities, making it appealing to established families seeking a suburban lifestyle. (Suburbs to watch: The Basin, Bayswater, Ferntree Gully, Rowville)
- Dandenong ranks #5, with a median value of $773,031 and a growth rate of +5.2 per cent. It continues to attract a diverse population due to its role as a manufacturing hub, with improvements in health infrastructure enhancing employment prospects. (Suburbs to watch: Dandenong, Noble Park, Dandenong North, Springvale)
View agent & property tools

Our powerful property tools

