
 - https://sketchapp.com --%3e %3ctitle%3eIcon/search%3c/title%3e %3cdesc%3eCreated with Sketch.%3c/desc%3e %3cg id='Icon/search' stroke='none' stroke-width='1' fill='none' fill-rule='evenodd' stroke-linecap='round' stroke-linejoin='round'%3e %3ccircle id='Oval' stroke='%23252525' cx='10.5145111' cy='10.5145111' r='6.99455261'%3e%3c/circle%3e %3cpath d='M15.4908752%2c15.4908752 L20.5515137%2c20.5515137' id='Line' stroke='%23252525'%3e%3c/path%3e %3c/g%3e%3c/svg%3e)

Perth property market news - key takeaways
- Price growth outpaces the nation: The Perth property market recorded a +2.1 per cent rise in dwelling values over the month and +26.0 per cent over the year, making it the strongest-performing capital city by a wide margin.
- Supply remains critically tight: Total listings in Perth are -29.0 per cent below this time last year, with homes selling in just 9 days on average, less than a third of the national median.
- Sellers hold firm on price: Perth vendors are discounting by just -2.6 per cent from their asking price, compared with -3.2 per cent a year ago, reflecting strong seller confidence in a market where competing offers arrive fast.
- Rental conditions near record tightness: Perth's vacancy rate sits at just 0.5 per cent with annual rent growth of +6.7 per cent, meaning tenants face one of the most constrained rental markets in the country.
- Rate rises add pressure to borrowers: The RBA lifted the cash rate to 4.10 per cent in March 2026 and market pricing points to further hikes ahead, adding to the cost of financing a home at Perth's current median of $1,039,949.

Get a free property value estimate
Find out how much your property is worth in today’s market.
Perth property price movements
Perth's property market continued to stand apart from the national trend in April 2026, posting gains that few other capital cities are matching. Very low stock levels and persistent buyer demand are keeping upward pressure on values even as other cities cool.
Perth property prices - May 2026
Perth's property market kept its run going strongly through April 2026, with values rising +2.1 per cent over the month. Annual growth of +26.0 per cent places Perth well ahead of every other capital city over the past year.
| Property type | Current median price | Monthly change | Quarterly change | Annual change |
|---|---|---|---|---|
| All Perth dwellings | $1,039,949 | +2.1% | +6.8% | +26.0% |
Source: Cotality
The median home value in Perth reached $1,039,949 in April 2026, up from around $1,018,560 the prior month, a gain of approximately $21,389. Tim Lawless, Research Director at Cotality, said in the Cotality Home Value Index, "In dollar terms, the 7.3 per cent rise in Perth home values over the quarter has added approximately $69,000 to the median dwelling value. Clearly this pace of growth is unsustainable, but continues to be supported by low supply, with advertised stock levels tracking about 40 per cent below the five-year average for this time of the year."
House prices in Perth
Perth house prices rose +2.1 per cent in April 2026, matching the broader market's monthly pace and pushing the median house value to $1,087,507. The Perth housing market has now delivered +25.7 per cent annual growth, adding roughly $222,000 to the typical house value over the year.
| Property type | Current median price | Monthly change | Quarterly change | Annual change |
|---|---|---|---|---|
| Perth houses | $1,087,507 | +2.1% | +6.7% | +25.7% |
Source: Cotality
The prior-month median sits at around $1,065,140, meaning the typical Perth house gained approximately $22,367 in a single month. Quarterly growth of +6.7 per cent tells a consistent story: the pace has barely let up across the past three months.
Unit prices in Perth
Perth unit prices outpaced houses in April 2026, rising +2.2 per cent over the month to a median of $759,687. Perth unit prices have climbed +27.9 per cent over the year, the strongest annual gain of any dwelling type in the city.
| Property type | Current median price | Monthly change | Quarterly change | Annual change |
|---|---|---|---|---|
| Perth units | $759,687 | +2.2% | +7.7% | +27.9% |
Source: Cotality
The April median of $759,687 compares to a prior-month figure of around $743,334, a gain of roughly $16,353 in one month. The quarterly gain of +7.7 per cent for units is slightly ahead of houses, suggesting that buyers are increasingly turning to the more affordable end of the market as house prices push further above $1,000,000.
Perth property market forecasts 2026
Australia's Big 4 banks publish annual dwelling price forecasts as part of their economic research, and views on Perth for 2026 vary considerably across the four institutions. That spread is unusually wide this year, reflecting genuine disagreement about how much the rate environment will weigh on a market that has been one of the strongest performers in the country.
- CBA: CBA predicts Perth property prices to rise +15.0 per cent over 2026.
- Westpac: Westpac predicts Perth property prices to rise +8.0 per cent over 2026.
- NAB: NAB's published forecast is at the Western Australia state level; it predicts dwelling prices to rise +6.6 per cent over the next 12 months across Western Australia.
- ANZ: ANZ predicts Perth property prices to rise +12.3 per cent over 2026.
The Perth house price forecast range spans from +6.6 per cent (NAB, at the state level) to +15.0 per cent (CBA), a gap that reflects very different assumptions about how rising interest rates will dampen what has been extraordinary recent momentum. Even Westpac, the most cautious of the four on Perth property market predictions, is forecasting growth that would rank highly against most other capital cities. The consensus direction is clear: further gains, with the debate centred on magnitude.
Consultancy KPMG sits broadly in line with ANZ, forecasting +12.2 per cent dwelling growth across 2026 (houses +12.8 per cent, units +11.6 per cent).
RBA cash rate forecast 2026
At its March 2026 meeting, the RBA lifted the cash rate to 4.10 per cent, up from 3.60 per cent previously. The decision was shaped by persistent inflationary pressures, a tight labour market, and capacity constraints, compounded by the energy price spike linked to the Middle East conflict. Financial market pricing and most bank economists expect further upward pressure on the cash rate through the remainder of 2026.
- CBA: CBA expects the cash rate to remain under pressure through 2026, with further hikes possible given elevated inflation, though it has not published a revised terminal rate forecast since the March decision.
- Westpac: Similar to CBA, Westpac has flagged upside risk to the cash rate in 2026 and anticipates rates will remain elevated, with no cuts expected in the near term.
- NAB: NAB's recent commentary points to at least one further rate rise in 2026, consistent with its view that underlying inflation will remain above the RBA's target band through the year.
- ANZ: ANZ has not published a revised cash rate forecast since the March 2026 decision, but its recent commentary points in the same direction as the broad market expectation that the current tightening cycle has further to run.
What this means for the Perth market
A cash rate of 4.10 per cent has a direct bearing on borrowing capacity, and Perth buyers are not immune despite the city's relative affordability advantage over Sydney and Melbourne. At current rates, a buyer financing the Perth median dwelling of $1,039,949 is carrying meaningfully higher monthly repayments than they would have 18 months ago, which adds real pressure to purchasing decisions even at Perth's price level.
That said, Perth's affordability position still allows credit to stretch further than in the southern capitals, which helps explain why the city continues to attract buyer demand even as rates rise. For first-home buyers and investors working near their borrowing limits, the rate environment is likely to concentrate activity in the unit segment and lower-priced outer suburbs, where the numbers still work at current lending conditions.
Several of these Big 4 forecasts were finalised before the March 2026 rate decision, so the full effect of that increase is not yet reflected in all published outlooks. Bank views may be revised in coming months, particularly if further rate rises materialise as financial markets currently expect.
Perth house prices graphs and charts
Perth house price growth over the last 5 years has moved from modest gains in the early part of the window to a strong “catch-up” surge from 2023 onwards. According to Cotality’s latest figures, in January, dwelling values were up by +2.0 per cent for the month, +7.0 per cent over the quarter, and +18.5 per cent over the year, taking Perth to a record high.
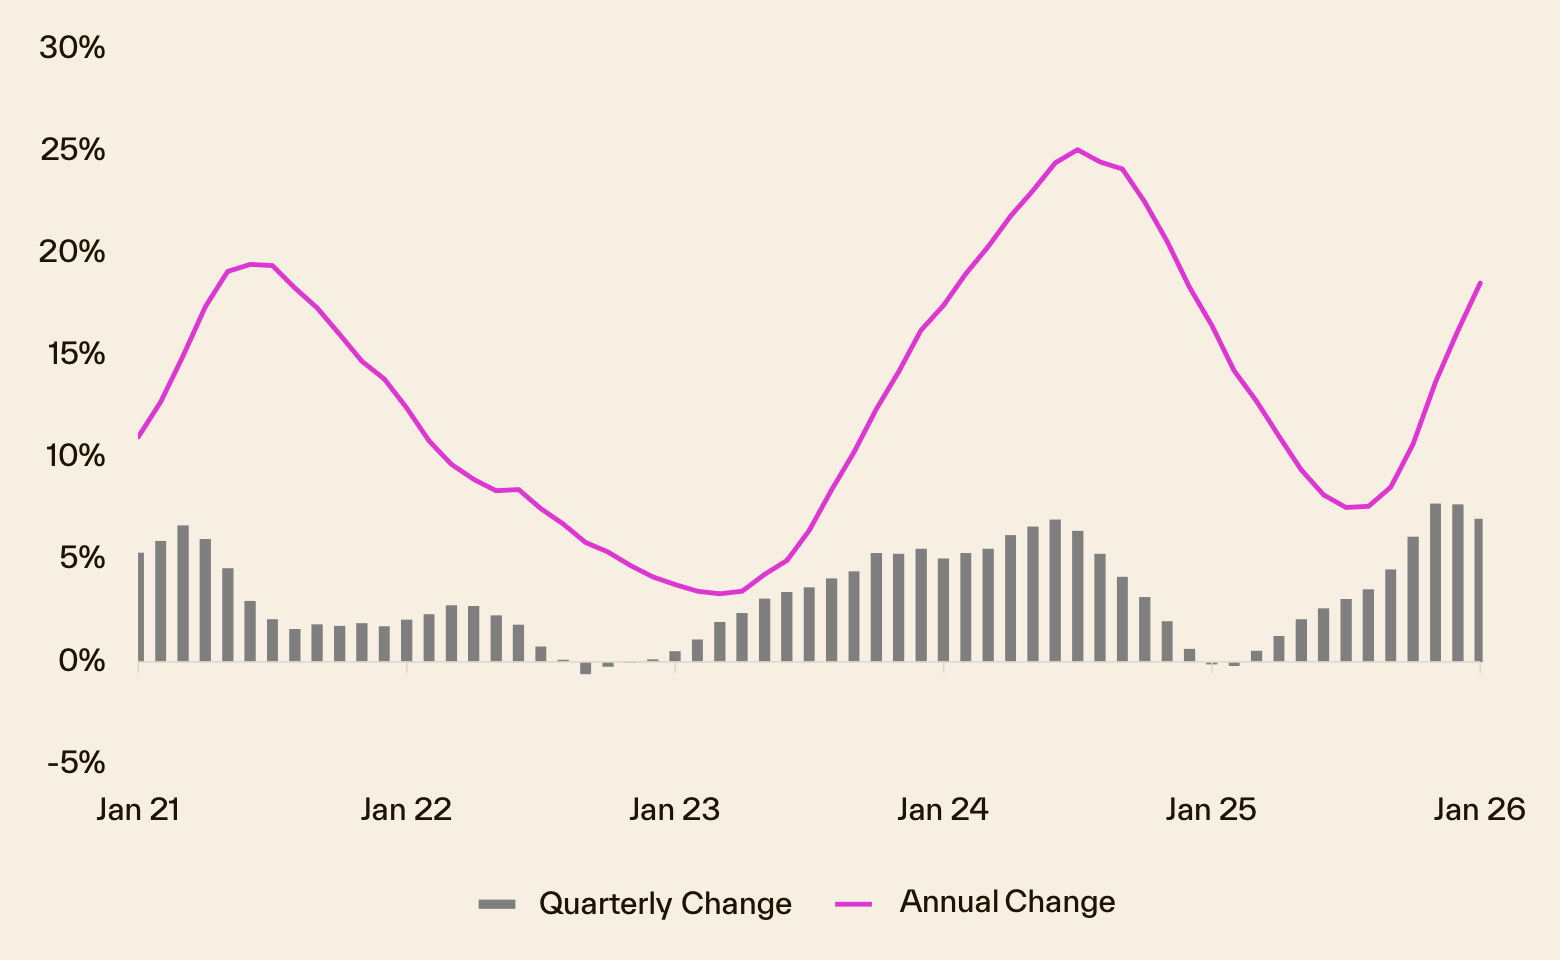
The five-year chart shows quarterly growth lifting consistently from 2023 and accelerating through 2024–25, with very few meaningful down quarters. Per Cotality’s analysis, that late lift reflects a tight listings pool and strong renter demand, which has kept Perth in a sellers’ market rather than letting prices fall back.
Perth property 30 year property price graph
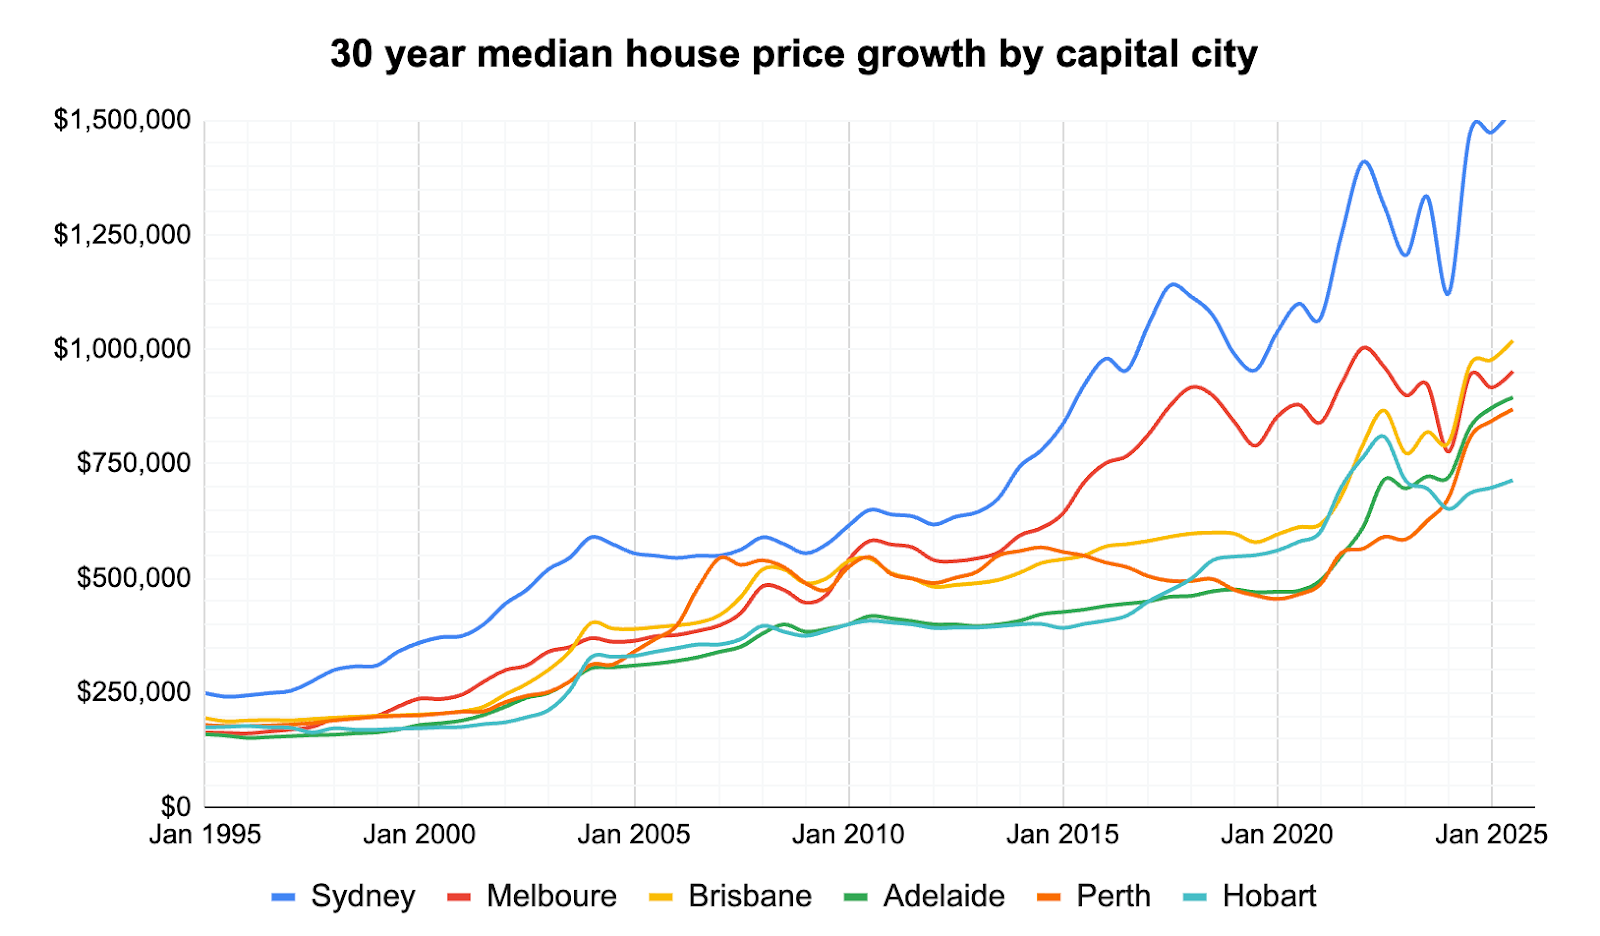
Recent gains sit on top of a long, cyclical history where booms and busts have tended to follow the state’s resource cycles, so Perth property prices growth over the last 10 years has been uneven — a long slump after the 2014 peak was followed by a powerful recovery and the current run to new highs around the $960,000 median range.
Over three decades, the market has been driven by shifting mining fortunes, changing population flows and periods of under-building that later tightened supply. Today, those same forces — stronger population growth, very low vacancy rates and limited new listings — are supporting prices. Homeowners are generally feeling more confident after recent gains, while buyers report frustration and urgency because higher repayments and scarce stock make finding and affording a home harder right now.
Perth selling statistics
Perth's selling market is operating under an extreme supply shortage that is compressing the time it takes to sell a property to levels rarely seen in any Australian capital. Fewer homes are coming to market, stock is being absorbed almost immediately, and sellers are holding firm on price. Those conditions are shaping every metric in this section.
Perth sales volume and days on market
Sales volumes in Perth fell -5.3 per cent year on year, a sharp contrast to the combined capitals aggregate, which rose +2.9 per cent over the same period, and the national figure of +4.7 per cent. Against that softer transaction count, properties are selling in just 9 days, down from 15 days a year ago.
| Perth sales volume | Perth days on market |
|---|---|
| -5.3% Change from 12mo ago | 9 days 15 days 12 mo ago |
Source: Cotality
Perth's 9-day median selling time is dramatically faster than the combined capitals average of 27 days and the national average of 30 days. The falling sales volume is not a sign of weak demand; it reflects a market where so few properties are available that transaction numbers are constrained by supply, not by buyers walking away.
Perth new and total listings
New listings fell -13.9 per cent year on year, and total listings dropped -29.0 per cent over the same period. Both figures point to a market where owners are choosing not to sell, and those who do are being snapped up before stock can accumulate.
| Perth new listings | Perth total listings |
|---|---|
| -13.9% Change from 12mo ago | -29.0% Change from 12mo ago |
Source: Cotality
A -29.0 per cent fall in total listings means buyers are competing for a dramatically smaller pool of available homes than they were a year ago. Cotality's Tim Lawless said "advertised stock levels tracking about 40 per cent below the five-year average for this time of the year." With so little choice on the market, sellers retain the upper hand and price growth is being sustained even as national conditions soften.
Perth vendor discount
Vendor discount measures the percentage difference between a property's initial asking price and its final sale price. A narrower discount means sellers are conceding less ground; a wider discount means buyers are extracting more from negotiations. We do not include weekly auction clearance rates for Perth because auction volumes are too low to be statistically meaningful.
| Mar 2026 | Mar 2025 | |
|---|---|---|
| Perth median vendor discount | -2.6% | -3.2% |
Source: Cotality
Perth vendors are currently discounting by just -2.6 per cent, compared with -3.2 per cent a year ago. The narrowing discount tells the same story as the days-on-market data: sellers are holding firmer, and buyers have little room to negotiate in a market where competing offers arrive quickly.
Get a deeper insight into how Perth sellers are faring in 2026 and what could be on the horizon for the remainder of the year with some of our latest articles.


Perth property investing
Perth's rental market remains one of the most pressured in the country, with very little slack for tenants and consistently strong returns for investors. Rents have climbed sharply over the past year, vacancy has tightened further, and yields sit comfortably above several of the larger capitals.
Perth rental market
The table below sets out how Perth compares with other cities and regions on three key measures: annual rent growth, gross rental yield, and the split between houses and units.
| Location | Rental rates | Rental yield | Annual change in rents, houses | Annual change in rents, units |
|---|---|---|---|---|
| National | 5.7% | 3.6% | NA | NA |
| Combined Capitals | 5.6% | 3.4% | NA | NA |
| Combined Regional | 6.0% | 4.2% | NA | NA |
| Sydney | 5.9% | 3.1% | 6.0% | 5.5% |
| Melbourne | 4.4% | 3.7% | 4.3% | 4.9% |
| Brisbane | 6.7% | 3.3% | 6.5% | 6.4% |
| Adelaide | 3.6% | 3.4% | 3.2% | 3.7% |
| Perth | 6.7% | 3.7% | 7.0% | 7.4% |
| Hobart | 6.4% | 4.3% | 7.0% | 5.5% |
| Darwin | 9.2% | 6.0% | 8.8% | 9.8% |
| Canberra | 2.6% | 4.0% | 3.3% | 2.0% |
Source: Cotality
Perth recorded annual rent growth of +6.7 per cent, matching Brisbane at the top of the capital city table and sitting well above the national figure of +5.7 per cent. Units have outpaced houses slightly, rising +7.4 per cent against houses at +7.0 per cent, suggesting smaller dwellings are seeing particularly strong demand pressure. At 3.7 per cent, Perth's gross yield is above Sydney and Brisbane, reflecting a market where values, while rising fast, have not yet compressed returns to the same degree as the southern coastal capitals.
Perth vacancy rates
The vacancy rate is the share of rental properties sitting empty at any given time. A lower rate means fewer choices for tenants and, broadly, more pricing power for landlords. SQM data shows Perth's vacancy rate fell from 0.6 per cent a year ago to 0.5 per cent in April 2026.
| Location | Mar 2026 vacancy rates | Mar 2026 vacancies | Mar 2025 vacancy rates | Mar 2025 vacancies |
|---|---|---|---|---|
| National | 1.0% | 31,732 | 1.1% | 34,428 |
| Sydney | 1.1% | 8,469 | 1.3% | 9,412 |
| Melbourne | 1.4% | 7,549 | 1.5% | 8,194 |
| Brisbane | 0.8% | 2,662 | 0.9% | 3,207 |
| Adelaide | 0.7% | 1,071 | 0.6% | 988 |
| Perth | 0.5% | 988 | 0.6% | 1,091 |
| Hobart | 0.4% | 121 | 0.5% | 148 |
| Darwin | 0.4% | 93 | 0.8% | 210 |
| Canberra | 1.1% | 700 | 1.5% | 909 |
Source: SQM Research
Perth's 0.5 per cent vacancy rate is less than half the national rate of 1.0 per cent, placing it among the most constrained rental markets in the country alongside Hobart and Darwin. With just 988 rental properties vacant across the entire city, the absolute number of available rentals is strikingly low. The year-on-year decline from 1,091 vacancies to 988 shows conditions have tightened further, not eased, even as rents have moved sharply higher.
Louis Christopher, Managing Director at SQM Research said in the latest SQM rental market report:
"The national vacancy rate dropping to 1.0% highlights just how tight Australia's rental market has become. We are now seeing vacancy rates at critically low levels in several cities, particularly Perth, Darwin and Hobart."
Perth is one of the three cities named directly in this assessment, and the data backs the characterisation. A vacancy rate of 0.5 per cent leaves almost no buffer between current rental supply and the city's tenant demand, meaning any further reduction in available stock could push rents even higher. For investors, that supply squeeze translates into strong rental income prospects and low risk of extended vacancy periods.
Highest growth areas in Perth
Perth's top-performing SA3 regions in April 2026 span the city's outer south-east, north-west and south-west corridors. The table below ranks the ten Statistical Area Level 3 (SA3) regions across Greater Perth by annual percentage growth, where an SA3 is an ABS geographic classification that typically covers several adjacent suburbs.
| Rank | SA3 Name | SA4 Name | Median Value | Annual % Change |
|---|---|---|---|---|
| 1 | Serpentine - Jarrahdale | South East | $952,461 | 32.4% |
| 2 | Armadale | South East | $923,563 | 31.8% |
| 3 | Belmont - Victoria Park | South East | $1,026,197 | 30.0% |
| 4 | Wanneroo | North West | $1,005,581 | 29.2% |
| 5 | Swan | North East | $963,897 | 29.1% |
| 6 | Canning | South East | $1,128,793 | 28.7% |
| 7 | Rockingham | South West | $929,286 | 28.3% |
| 8 | Stirling | North West | $1,158,139 | 28.2% |
| 9 | Gosnells | South East | $922,865 | 27.9% |
| 10 | Kwinana | South West | $804,785 | 27.1% |
Source: Cotality
Highlights for Perth’s high growth areas
- Serpentine - Jarrahdale: Ranked #1 across Greater Perth with annual growth of +32.4 per cent and a median value of $952,461, Serpentine - Jarrahdale sits on Perth's outer south-eastern edge where buyers are drawn by larger land parcels and relative affordability compared to established middle-ring suburbs. Demand here is largely driven by families seeking space at a price point that has become harder to find closer to the CBD.
- Armadale: Ranked #2 with +31.8 per cent annual growth and a median value of $923,563, Armadale is one of Perth's most accessible entry points for buyers looking to remain within the metropolitan area. Infrastructure investment in the region and ongoing population growth in Perth's south-east corridor continue to support demand.
- Belmont - Victoria Park: Ranked #3 with +30.0 per cent annual growth and a median value of $1,026,197, Belmont - Victoria Park occupies a middle-ring position close to the CBD and the Swan River. Its relative affordability compared to neighbouring inner suburbs has attracted both owner-occupiers and investors seeking proximity without the premium price tag.
- Northern growth corridor, Wanneroo and Swan: Ranks #4 and #5, Wanneroo (+29.2 per cent, $1,005,581) in the North West and Swan (+29.1 per cent, $963,897) in the North East, reflect sustained demand across Perth's northern growth corridor. Both areas offer land availability and median values that remain below the city-wide median for houses, keeping them accessible to a broad range of buyers.
- South-east and south-west outer ring: Ranks #6 through #8, Canning (+28.7 per cent, $1,128,793), Rockingham (+28.3 per cent, $929,286) and Stirling (+28.2 per cent, $1,158,139), span both sides of the city's outer ring, with Rockingham offering a coastal lifestyle at comparatively lower price points and Stirling providing established amenity in the north-west. Ranks #9 and #10, Gosnells (+27.9 per cent, $922,865) and Kwinana (+27.1 per cent, $804,785), round out a sweep of outer southern suburbs where Perth's lowest medians in this top-ten list are still recording growth comfortably above the city-wide annual average.
View agent & property tools

Our powerful property tools

