OpenAgent Consumer Sentiment Report - 2023 Q1

Here at OpenAgent, we know the importance of up-to-date market insights. As Australia’s largest real estate comparison and referral platform, we speak to thousands of homeowners every month who are on the hunt for the right real estate agent to sell their home.
We’re always looking for the best way to add value for our audience, and we realised that by speaking to a broad spectrum of homeowners across the country, we’re in a unique position to capture the market perspectives of one of the most important groups in the real estate ecosystem - sellers.
In November 2016, we started compiling anonymised data that captures the sentiment and market expectations of consumers who are actively looking to sell their property.
April 2017 saw the inaugural release of the OpenAgent Consumer Sentiment Report, an ongoing quarterly publication that tracks market expectations of active vendors over time.
The latest installment of this report, covering sentiment from January 2019 until the end of March 2019, shows some fascinating developing trends in sentiment across Australia, based on a total of over 35,578 responses across 29 months.
As you’ll see below, this regular report includes home price sentiment at a National, State and Metro level, as well as granular information about why people are selling, and what they see as the key factors driving their local markets.
We hope you enjoy this report, and we look forward to delivering many unique insights in the quarters to come.
- Sincerely yours, Zoe & Marta, Co-Founders of OpenAgent
How the Consumer Sentiment Index Works
To build the Consumer Sentiment Index, we ask our vendors the following question:
Where do you expect home prices to be in your area in six months’ time?
Vendors then rank their answer on a 5 tier scale, ranging from Strongly Up, Slightly Up, About The Same, Slightly Down and Strongly Down.
"To build the Consumer Sentiment Index, we ask our vendors the following question: Where do you expect home prices to be in your area is six months' time?"
This information is then collated to provide the basis for our proprietary index system. The index gives a measure of vendors’ expectations for home price movement on a scale of -10 to +10, with a reading of 0 being a neutral view of the market.
Values above +5 indicates strong overall optimism and values below -5 indicates strong overall pessimism.
In 2019 Q1, we collected a total of 4,156 survey responses from OpenAgent customers all across Australia. All of our responses have been weighed against the relevant cohorts at the state level to remove any bias and present a realistic snapshot of sentiment for that group.
Using this methodology, we ensure that the Consumer Sentiment Index is relevant for all vendors, not just OpenAgent’s customers.
National Consumer Sentiment
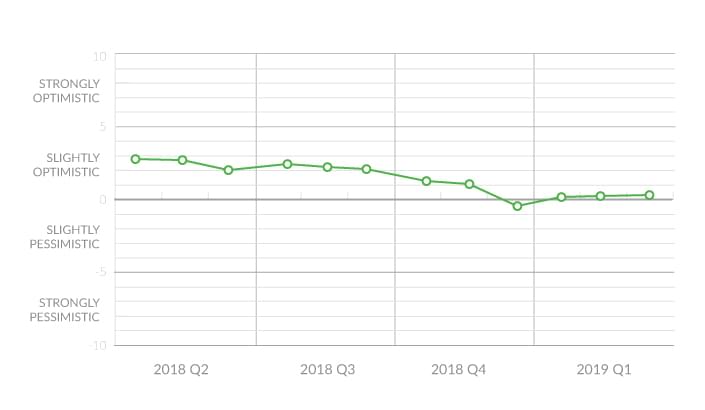
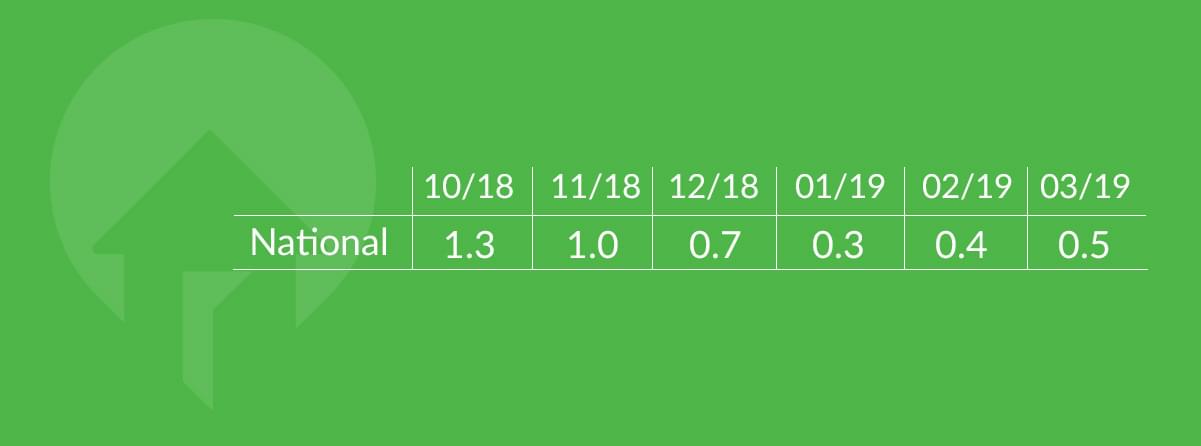
For Q1 2019, seller sentiment across Australia has remained consistent, with March ending on an index of +0.5. Index figures in January dropped 5 points to +0.3, the lowest recorded score on a national index, from +0.7 just the month before.
Overall, we have seen a consistent downward trend, with the index falling from +2.1 in September to +0.7 in December and +0.5 in March. This signals that Australians have reached a general consensus that the market has well and truly cooled.
State Consumer Sentiment
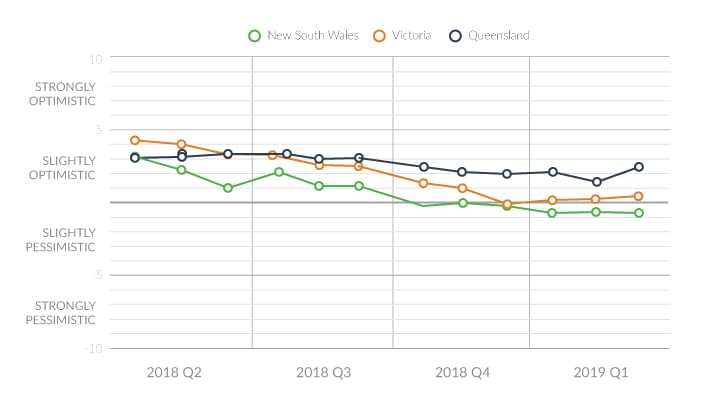
NSW
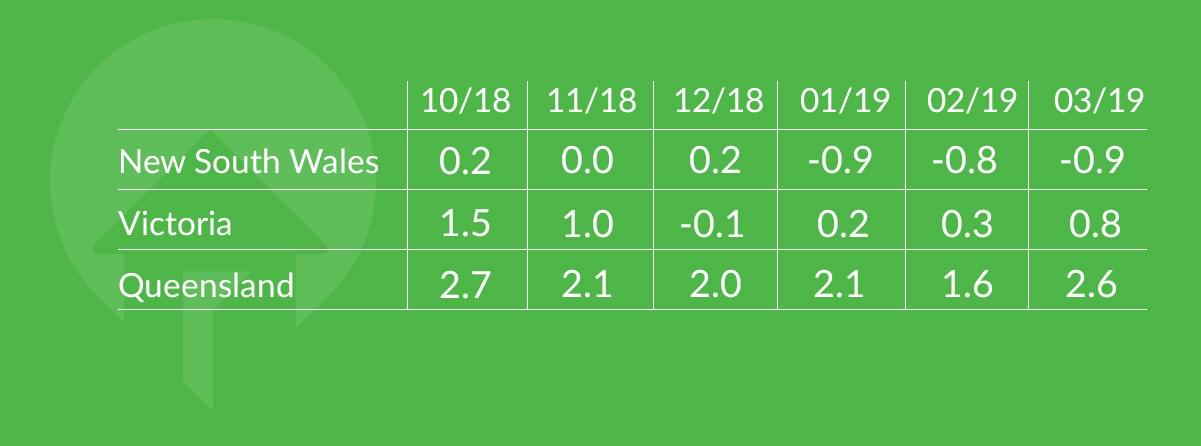
In NSW we started off the year with the consumer sentiment index breaking the naught mark, recording a value of -0.9 in January. This value stayed relatively the same for the rest of the quarter, with the majority of NSW consumers believing that property prices will be slightly down in the next six months, rather than staying about the same.
VIC
Victorian seller sentiment has bounced back from a sentiment of -0.1 in December 2018 up into the positive this quarter. Surprisingly, index values for Victoria trended up, finishing at +0.8 in March.
This marginal increase in sentiment could be linked to higher clearance rates seen across Victoria in January, February and March, compared to what we saw in the market at the end of 2018.
QLD
Compared to other states across Australia, Queensland remains relatively strong, especially in comparison to New South Wales and Victoria where we have seen index scores plummet since the end of 2016.
March indexes for Queensland have shot up 0.6 points to +2.6 compared to December last year where we recorded an index value of +2.
WA
In Q1 2019, sentiment fluctuated more in Western Australia compared to other states. We saw sentiment dip to -0.1 in January from +0.6 in December. By the end of the quarter, Western Australia was recording an index of -1.2, the lowest since 2017.
Metro vs. Regional Consumer Sentiment
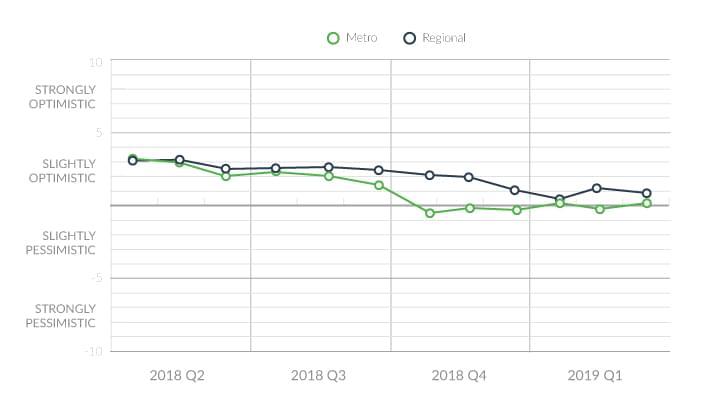
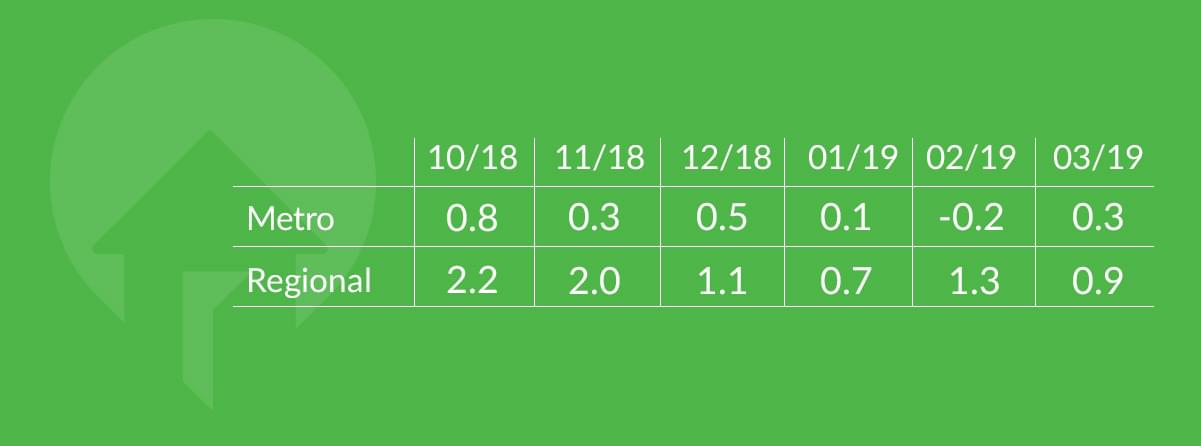
Seller sentiment in metro regions across the country continued to fall in 2019 Q1. In February 2019, it even fell to -0.2, which is unprecedented in the Consumer Sentiment Index’s history.
Regional sellers are a little bit more optimistic than metro sellers, with the regional index recording a value of 0.7 in January, up to 1.3 in February and back down to 0.9 in March. It’s not all good news though; just like sentiment in metro areas, the sentiment values we see in regional areas has also been dropping over the past year.
Capital Cities
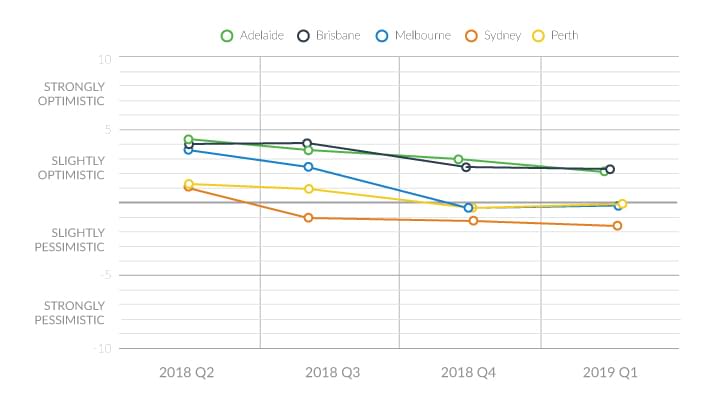
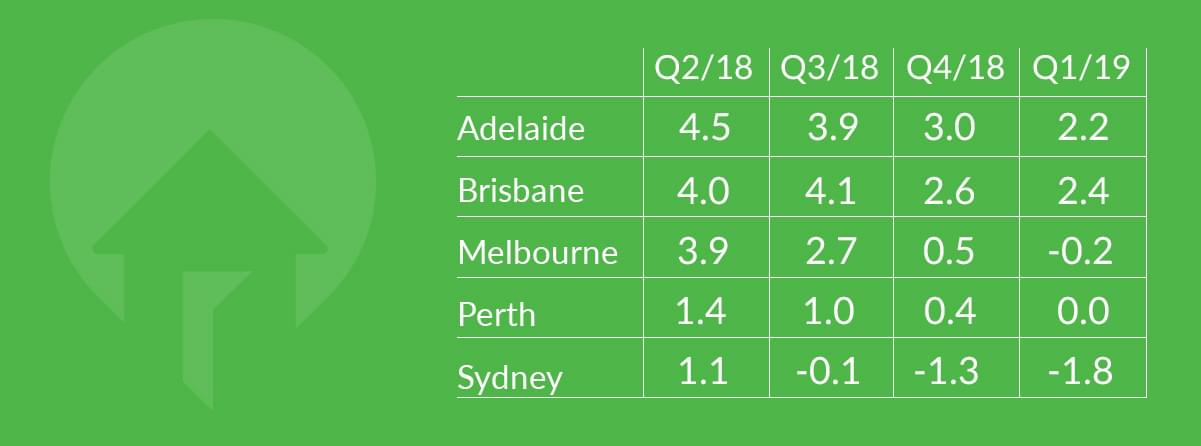
Sentiment across Australia’s capital cities has followed last year’s trend and has continued to decrease. In 2019 Q1, all capital cities have fallen, with Adelaide recording the largest jump, falling from an index score of 3 down to 2.
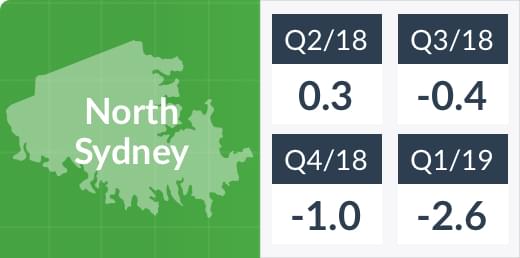
While Sydney continues to lead the charge in negative sentiment, recording a value of -1.8, Melbourne has now joined its ranks, also recording a negative sentiment below zero. This is in stark contrast to the same period in 2017, where Melbourne recorded a positive sentiment of 6, and Sydney sat on 6.6. How the market has turned.
Investor vs. Owner Occupier Sentiment
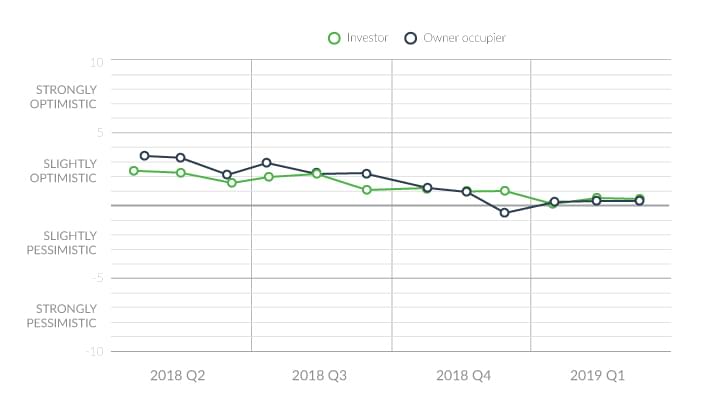
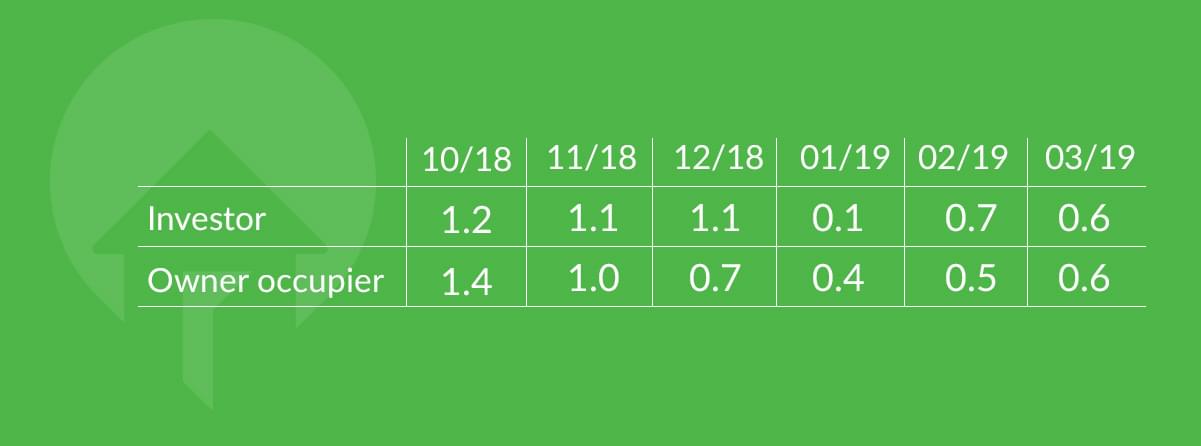
Investor sentiment dropped further this quarter, from 1.1 in December down to 0.1 in January. This is the lowest sentiment value for investment sellers ever recorded.
Historically, the Consumer Sentiment Index has shown a trend for owners to display a more positive outlook than investors, but Q1 2019 shows that gap is closing. In Q1 2019, owner sentiment dropped to 0.6 in March.
Interestingly, for the first time in February 2019 tenants and buyers have also shown negative sentiment.
Highlight: Greater Sydney trends
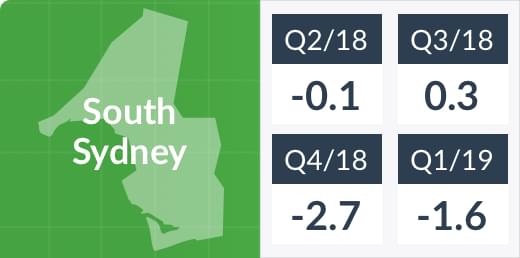
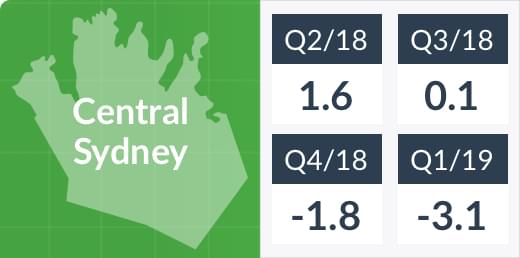
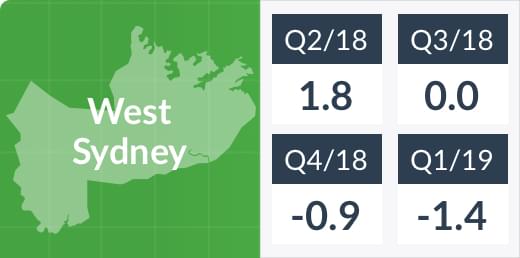
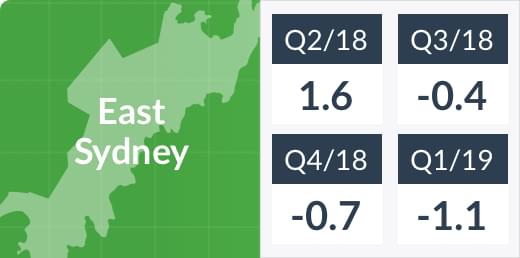
Our index also takes a deep dive into Sydney, Greater Sydney and its surrounding regions of the Illawarra and Newcastle/the Central Coast.
This quarter, seller sentiment dropped across all Sydney regions. The only positive sentiment displayed by sellers can be found in a group we call the ‘Rest of NSW.’ This group recorded a value of 0.6, which is a significant decrease from 2.9 in Q4 2018.
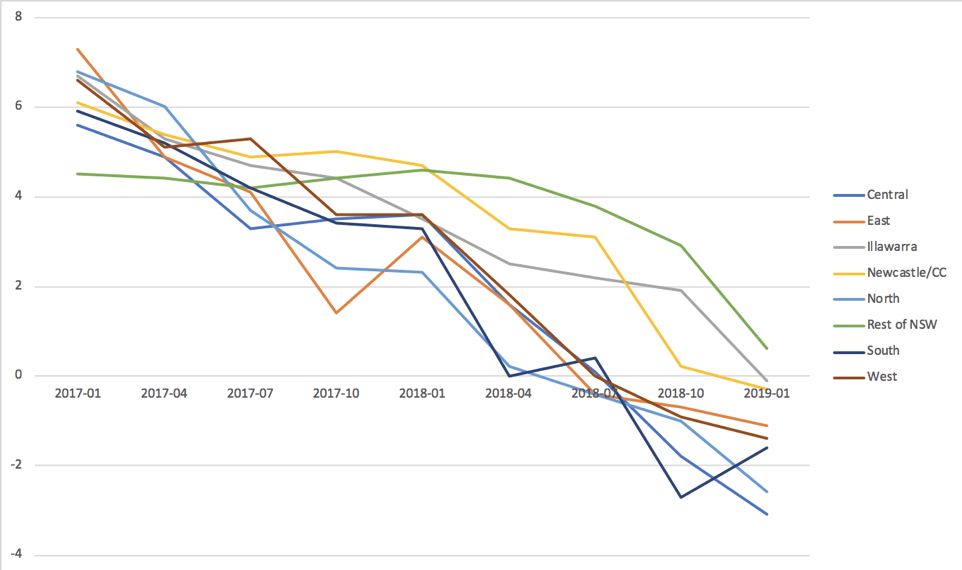
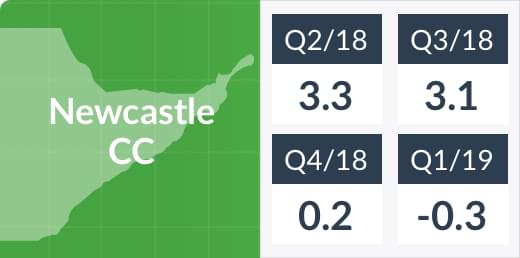
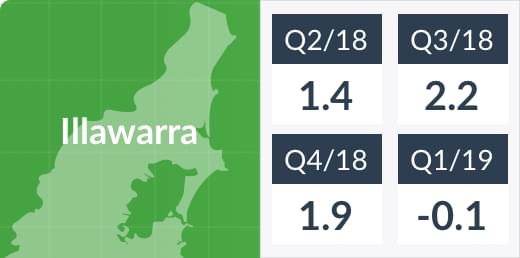
Two regions moved from positive to negative sentiments this quarter; Newcastle/the Centeral Coast (-0.3) and the Illawarra (-0.1). Still this is a far cry from the sentiment we see in Central Sydney, which recorded the worst value across the Sydney region at -3.1.