OpenAgent Consumer Sentiment Report - 2018 Q3

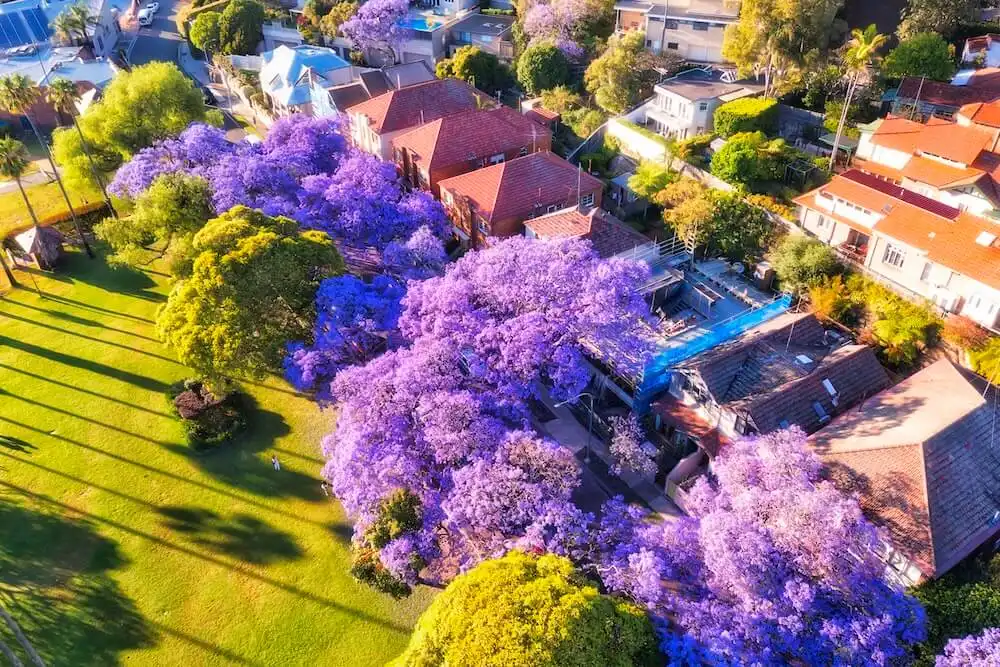
Here at OpenAgent, we know the importance of up-to-date market insights. As Australia’s largest real estate comparison and referral platform, we speak to thousands of homeowners every month who are seeking assistance in selecting the right person to sell their largest financial asset.
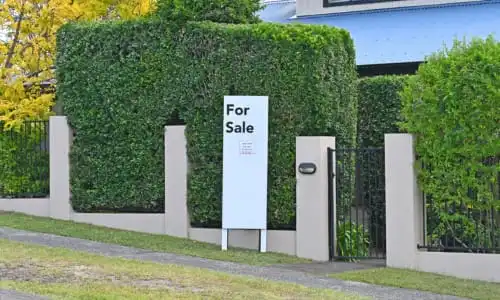
We’re always looking for ways to add value for our customers, and we realised that by speaking with such a broad range of homeowners all over Australia, we had the unique ability to capture the market perspectives of one of the most important groups in the real estate ecosystem - home sellers.
In November 2016, we began compiling anonymised data capturing the sentiment and market expectations of consumers who were actively looking to sell their property.
April 2017 saw the inaugural release of the OpenAgent Consumer Sentiment Report, an ongoing quarterly publication that will track the market expectations of active vendors over time.
The latest installment of this report, covering sentiment from July until the end of September 2018, shows some fascinating developing trends in sentiment across Australia, based on a total of over 27,779 responses across 23 months.
As you’ll see below, this regular report includes home price sentiment at a National, State and Metro level, as well as granular information about why people are selling, and what they see as the key factors driving their local market.
We hope you enjoy this report, and we look forward to delivering many unique insights in the quarters to come.
Sincerely yours, Zoe & Marta, Co-Founders of OpenAgent
How the Consumer Sentiment Index Works
To build the Consumer Sentiment Index, we ask our vendors the following question: Where do you expect home prices to be in your area in six months’ time? Vendors then rank their answer on a 5 tier scale, ranging from Strongly Up, Slightly Up, About The Same, Slightly Down and Strongly Down.
"To build the Consumer Sentiment Index, we ask our vendors the following question: Where do you expect home prices to be in your area is six months' time?"
This information is then collated to provide the basis for our proprietary index system. The index gives a measure of vendors’ expectations for home price movement on a scale of -10 to +10, with a reading of 0 being a neutral view of the market.
Values above +5 indicate strong overall optimism and values below -5 indicate strong overall pessimism. In 2017 Q2, we collected a total of 2,556 survey responses from OpenAgent customers all across Australia. All of our responses have been weighed against the relevant cohorts at the state level to remove any bias and present a realistic snapshot of sentiment for that group.
Using this methodology, we ensure that the Consumer Sentiment Index is relevant for all vendors, not just OpenAgent’s customers.
National Consumer Sentiment
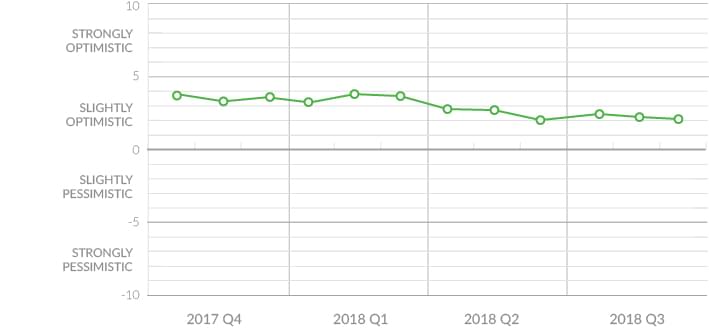
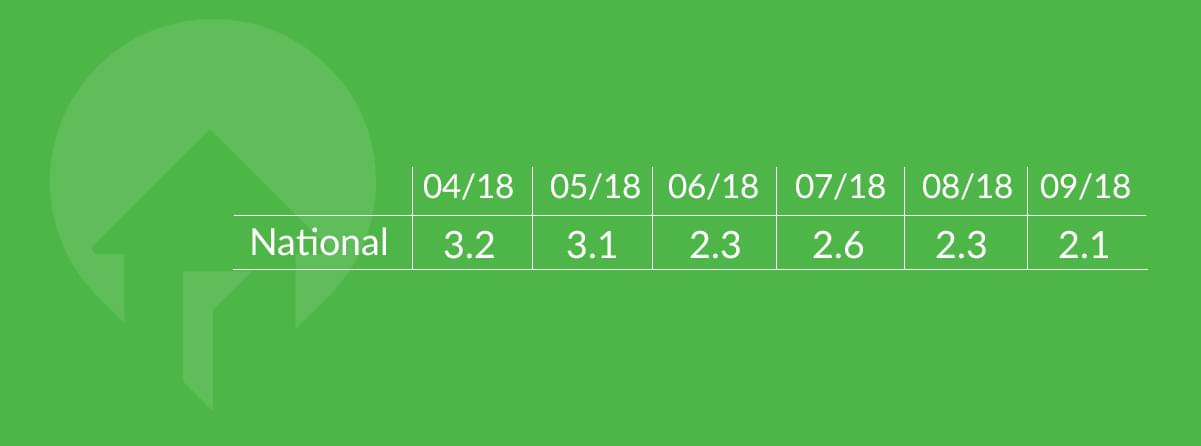
For Q3 2018, sentiment across Australia has remained quite consistent with what was seen at the end of last quarter, with June ending on an index of +2.3. Figures at the beginning of this quarter improved with a rise from the month before to +2.6 points in July, before falling to +2.1 in September - the lowest recorded score on a national index.
This continuous downward slope in sentiment is seen to be the result of the cooling market led by Sydney and Melbourne. Contributing factors include the surge in new property developments, tighter lending criteria and a reduction in foreign buyers.
State Consumer Sentiment
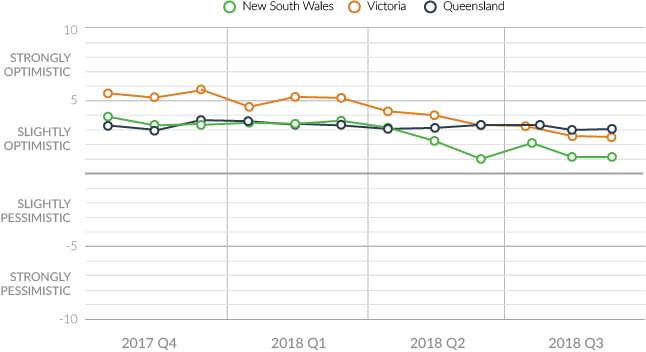
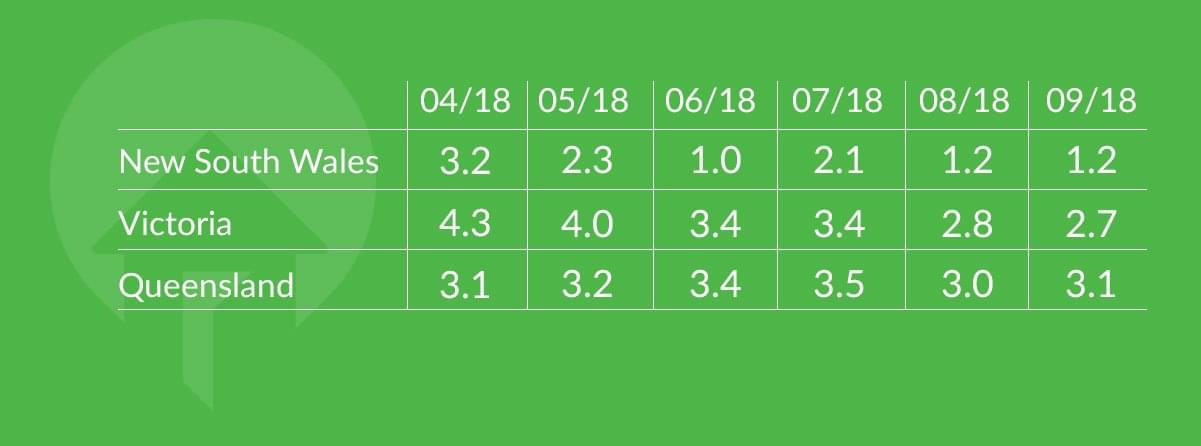
NSW
The OpenAgent consumer sentiment index for NSW ended Q2 2018 on a gloomy note with an index of +1.0, the lowest sentiment score recorded in NSW.
The beginning of Q3 saw a jump in sentiment score to +2.1, followed by negative sentiment showering the remainder of August and September. Index values ended the quarter on +1.2 points, matching periods when clearance rates continued to plummet.
VIC
Sentiment in Victoria was overcast with seller confidence stagnating in June and July at +3.4 before dropping in Q3, falling to +2.8 in August and dipping further to +2.7 in September. This is a sharp contrast to the +5.4 index value that we saw in Victoria during the same time last year.
This quarter’s index marks the lowest score since 2016 and the first time the state sentiment has dropped below +3.0 in Victoria.
This reinforces the decline in confidence from Victorian customers for future property prices.
QLD
The beginning of Q3 2018 held steady for Queensland at +3.5 points in July, before falling slightly to +3.0 in August and making a small bounce back up to +3.1 in September.
On the Sunshine Coast, sentiment is reflected in the city's name as scores remain relatively strong throughout the quarter, staying above +3.0.
Overall, Queensland has remained consistently stable throughout the course of 2018, with the biggest drop in sentiment recorded at +1.6 points in the months of April and May in 2017.
WA
Q3 2018 was turbulent for Western Australia, with the index tumbling to a negative recording of -0.1 in July before recovering to an index of +2.0 in August and then falling back to +0.4 in September.
The negative value in July is the lowest recording since December 2017.
The decline in sentiment is similar to the general trends seen across the nation. This drop however, has been delayed by a quarter, signalling there may be more negative sentiment to come in the months ahead.
Metro vs. Regional Consumer Sentiment
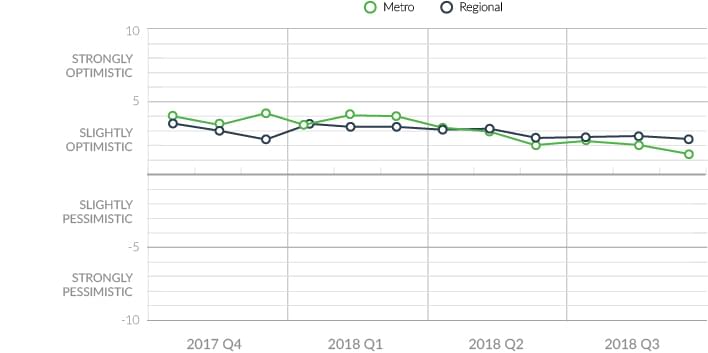
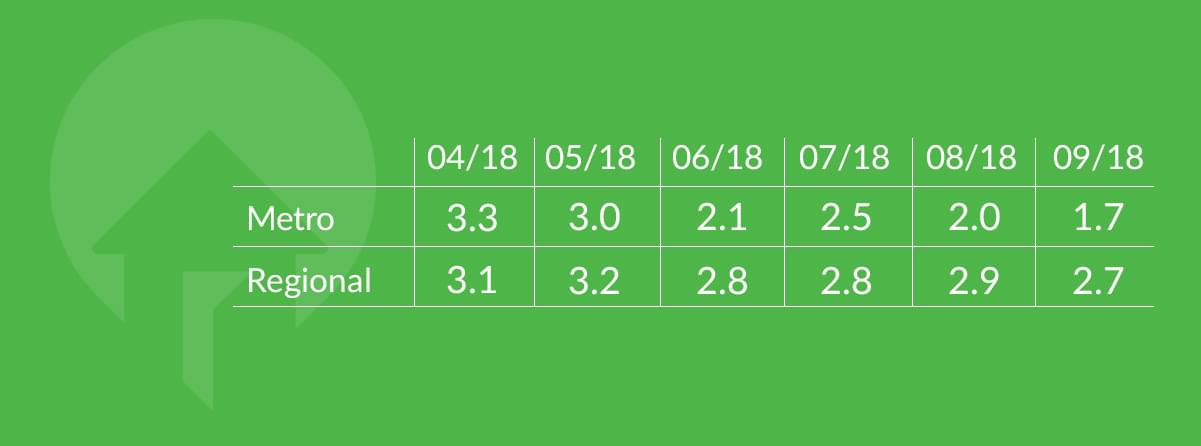
Metro regions witnessed a small bounce in sentiment from +2.1 in June to +2.5 in July. Index scores for the remainder of Q3 2018 accelerated in decline falling to +2.0 in August before hitting a record low of +1.7 in September.
The average sentiment index for this quarter hovers around +2.0 points - a stark contrast to the index average of +4.0 in the same quarter of 2017.
"The average sentiment index for this quarter hovers around +2.0 points - a stark contrast to the index average of +4.0 in the same quarter of 2017."
This is representative of the boom experienced in 2017 compared with the current cooling of the market.
On the other hand, regional areas have held steady over the last quarter with consumer sentiment averaging around +2.8 across the three months. The average sentiment index this quarter is the same as the quarter in the previous year.
Capital Cities
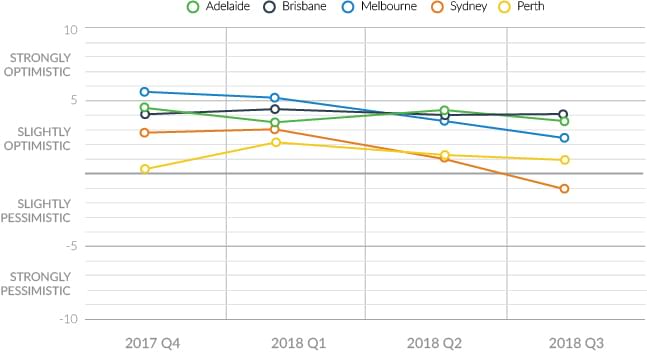
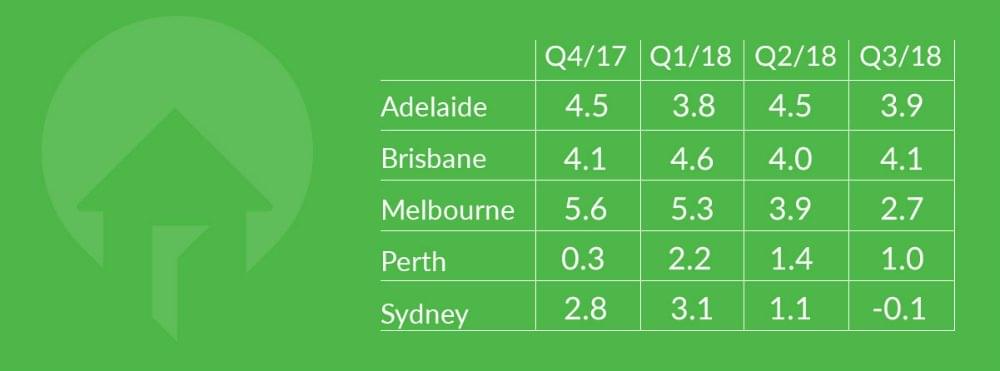
Seller confidence in Brisbane has been unwavering despite the declines in index scores seen across all other major cities, with the index increasing from +4.0 in Q2 to +4.1 in Q3. Brisbane reigns as the city with the highest national sentiment index this quarter, closely followed by Adelaide.
Sentiment in all other capital cities have weakened throughout Q3 2018, with Melbourne leading the fall with index scores dropping from +3.9 to +2.7 between Q2 and Q3. Adelaide and Perth had declines in scores of 0.7 and 0.5 respectively.
Conversely, seller confidence is tenuous in Sydney, with sentiment scores plunging into the negatives and ending the quarter on -0.1 points.
This is the first national negative score since 2017.
Investor vs. Owner Occupier Sentiment
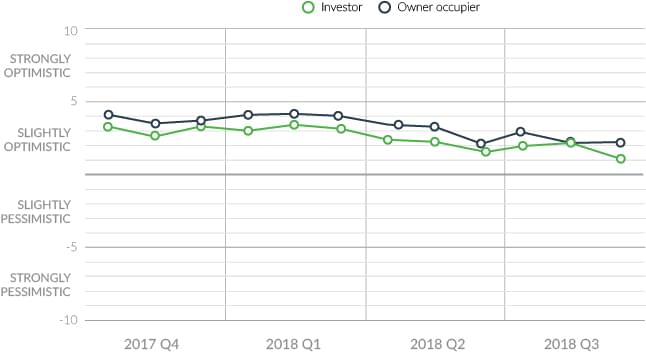
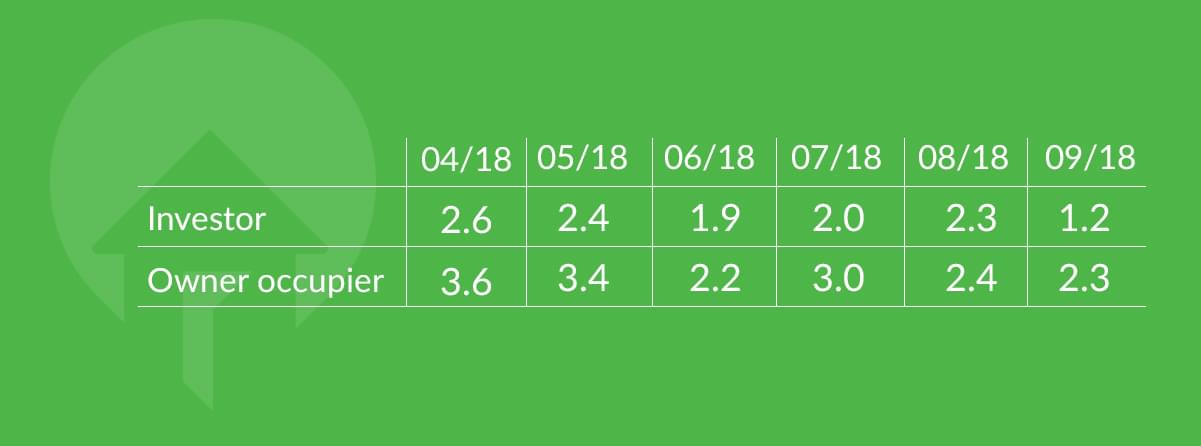
Investor sentiment continues to dip from the lowest index in the past two years from +1.9 in June to +1.2 in September. The average investor sentiment score for this quarter is +1.8 - a decline of 0.5 points compared to the average in Q2.
"The average investor sentiment score for this quarter is +1.8 - a decline of 0.5 points compared to the average in Q2."
This is a reflection of the tighter lending criteria affecting investors over the past half year.
Owner-occupier sentiment has slowly declined throughout 2018, ending Q3 on +2.3 in September. The average owner-occupier sentiment for this quarter is 0.5 points lower compared to last quarter. This matches the decline seen in average sentiment scores for investors.
Highlight: Greater Sydney trends
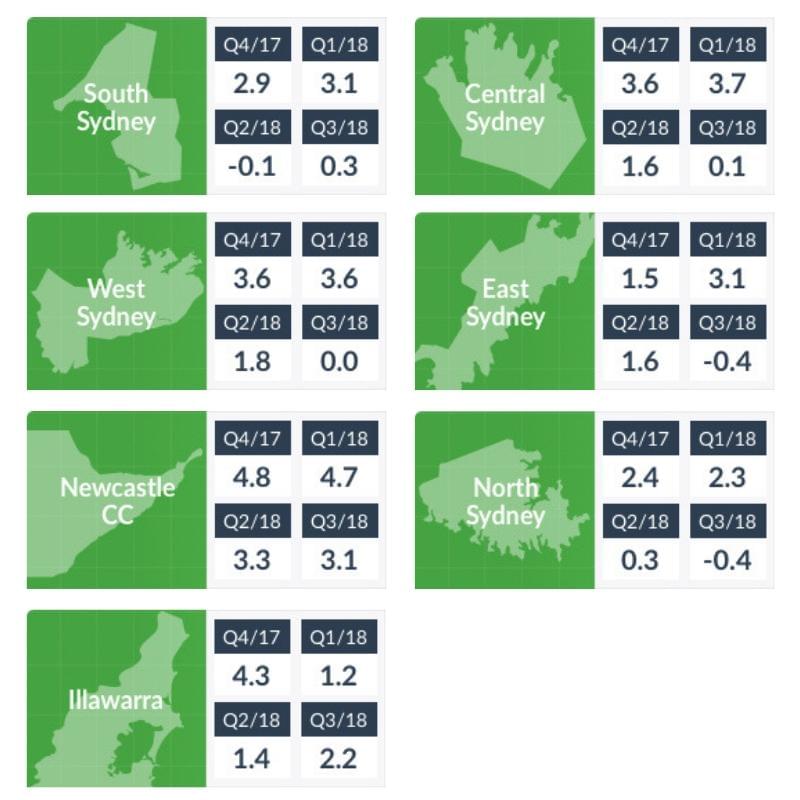
Our index takes a closer look at Greater Sydney and its surrounding regions including the Illawarra and the Central Coast.
In Q3, index values slipped throughout the entire Sydney area with the exception of South Sydney, which recovered from a negative sentiment of -0.1 in Q2 to end Q3 with a score of +0.3.
Central Sydney continues to fall, dropping 1.5 points from the last quarter, ending Q3 at +0.1. In the West, consumer confidence also fell 1.8 points from last quarter, ending this quarter on the lowest index recorded in the region at 0.0.
North and East Sydney have fared the worst, with sentiment scores slumping into the negatives, with both regions recording values of -0.4.
The ray of sunshine amidst the clouds is the Newcastle/Central Coast region, posting stable sentiment scores this quarter. Index scores are only 0.3 points lower than they were in Q1, ending Q3 with the highest score of all the regions at +3.1.
The overall sentiment of Q3 2018 was quite sombre, indicating that sellers are well and truly feeling the impact of the current downturn in the Australian property market. Major cities such as Sydney and Melbourne have taken the hardest hits, however Greater Sydney and its surrounding regions are also feeling the turbulent effects of the cooling market.