
Find the top real estate agents in Kalinga
As Australia's #1 real estate agent comparison site, we help over 2.6 million Australians research agents every year.*
Compare agents in:
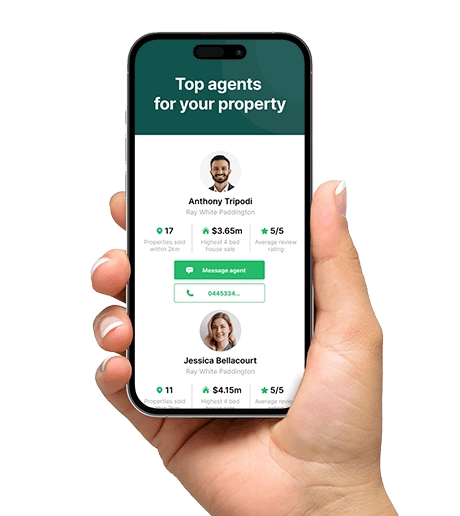
Some of the top local agents in Kalinga
These agents are strong performers in the local area.
Find out more about Kalinga property prices, market trends and demographics.

Cayle Blaxland
McGrath Estate Agents - Wilston
54
Sales (12m)
$4.1M
Highest sale
-
Experience

50 Houses
Sold (12m)

3 Units
Sold (12m)

Alycia Hoffman
Coronis North
66
Sales (12m)
$1.34M
Highest sale
8y
Experience
2 Houses
Sold (12m)
63 Units
Sold (12m)

Damon Warat
Ray White - Ascot
44
Sales (12m)
$8.2M
Highest sale
23y
Experience
31 Houses
Sold (12m)
11 Units
Sold (12m)
Get more personalised agent results tailored to your property and needs
What makes selling in Kalinga unique?
Kalinga's leafy streets and character timber houses give the suburb a community-oriented feel within Brisbane's inner north. While it appeals to a broad range of buyers, families make up an important part of the local market, often prioritising space, outdoor living and access to local schools and parks.
Different properties can appeal to very different audiences, so suburb-specific knowledge matters. Agents with experience in Kalinga understand those differences and can tailor pricing, presentation and marketing to suit the property and the buyers most likely to be interested.
Last Updated: November 2026
Kalinga property market trends and insights
Over the past year, house prices in Kalinga have increased 8% to $2.3m. There isn't enough data to report a median unit price. Auctions are uncommon here.
In Kalinga, 24 properties have come onto the market over the past year, down 31%, while 26 have sold, a decrease of 4%. With both listings and sales lower, homes here are selling in a median of 23 days, 2 days faster than the Inner North average.
With most properties selling within a month, selecting an experienced agent who can maximise buyer competition during a short, high-impact campaign can make a meaningful difference to your result.
| Metric | Current | Market insight |
|---|---|---|
| Median sale price (houses)(2) | $2.2M | Up 4.0% YoY |
| Median sale price (apartments)(2) | - | - |
| Auction clearance rate (12m)(1) | - | - |
| Listings (12m) | 24 | Down 29.4% YoY |
| Sales (12m)(2) | 21 | Down 34.4% YoY |
| Median days on market (12m)(2) | 24 days | 2 days faster than the Inner North area |
Last updated: November 2026, based on OpenAgent & Domain data
See which agents sold the most properties like yours in Kalinga
Why choosing the right local agent in Kalinga matters
Not all agents deliver the same results. We've analysed local sales data from the past year to show exactly how much the top-performing agents outpace the market average in Kalinga.
Sale price
Top agents achieved 1.0x higher prices than the Kalinga average.
Listings sold
The top 3 agents in Kalinga sell 52% more of their listings than the average in this area.
Proportion of total sales
The top 3 agents in Kalinga are responsible for 61.9% of all property sales in the suburb.
What to pay your Kalinga agent
In Queensland, real estate agent commission rates typically range from 0.56% to 5%.
Real estate commission rates are not regulated, meaning agents can set their own fees. Knowing the average commission in your suburb gives you a useful benchmark when comparing proposals.
Agent commissions are usually negotiable. While commission is an important consideration, it shouldn't be the only factor when choosing an agent. Instead, look for agents with local expertise who can justify their rate and clearly explain how they plan to maximise your sale outcome.
Real estate agents and property market trends in suburbs near Kalinga
Discover more about real estate in suburbs near Kalinga - compare top agents and explore suburb profiles with local insights.
- Real estate agents Wooloowin | Wooloowin suburb profile and market trends
- Real estate agents Clayfield | Clayfield suburb profile and market trends
- Real estate agents Lutwyche | Lutwyche suburb profile and market trends
- Real estate agents Kedron | Kedron suburb profile and market trends
- Real estate agents Albion | Albion suburb profile and market trends
(1) Auction clearance rate data has been sourced from Domain Insight.
(2) Sales, DOM and sale price data for the suburb were sourced from Domain Insight.
Source: Copyright © 2026 Australian Property Monitors Pty Ltd trading as Domain Insight (DI). This information is published and compiled by DI and in developing it DI also relies on the information supplied by a number of external sources.

Customer service centre: 1800 817 616
For more information about our data sources and methodology, please see our Website Data Disclaimers.