
Find the top real estate agents in Inner South
As Australia's #1 real estate agent comparison site, we help over 2.6 million Australians research agents every year.*
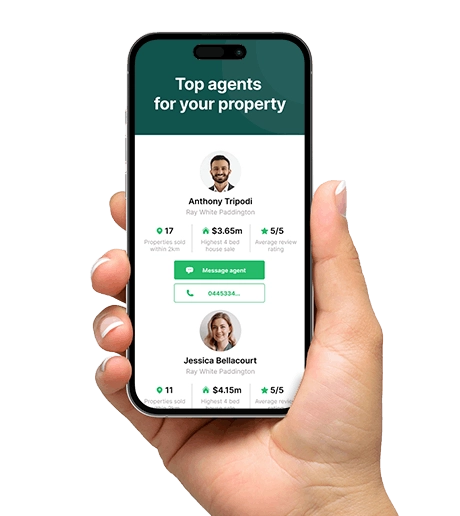
Some of the top local agents in the Inner South area
Across the 37 suburbs in and around Inner South, here are the agents that have sold the highest number of properties in the last 12 months.

Dean Sims
Bellcourt Property Group - South Perth
92
Sales (12m)
$3.97M
Highest sale
-
Experience

52 Houses
Sold (12m)

34 Units
Sold (12m)

Peter Zambotti
Haiven Property South
88
Sales (12m)
$5.25M
Highest sale
-
Experience
56 Houses
Sold (12m)
18 Units
Sold (12m)

Edward Lim
Ray White ELG
85
Sales (12m)
$2.11M
Highest sale
11y
Experience
43 Houses
Sold (12m)
31 Units
Sold (12m)
Get more personalised agent results, tailored to your property and needs

Erica - Glenroy

Mark - Deeragun

Todd - Armadale
We help over 2 million Australians research agents every year

Janet - Nerang

Rachel - Tweed Heads

Nathan - Mt Druitt
What makes selling in Inner South unique?
The Inner South is an inner-ring riverside pocket with a clear mix of market characters. South Perth, Applecross, Bicton and Mount Pleasant offer the area's defining riverfront homes and leafy family-friendly streets, while Victoria Park and Como bring a busier lifestyle angle with cafes and nightlife along Albany Highway. Median prices have been running hot, up 24.1% on the year to $1,185,000, the highest level in five years, though the pace may not be sustained, and the median is 2.5% above the prior peak set in April 2026.
Homes are selling in a median of 34 days, faster than a year ago, the fastest pace in five years. Auctions are clearing at 47% over the past year.(1) The health and tertiary precinct around Murdoch is drawing healthcare and university staff, and Canning Bridge's urban renewal is feeding new apartment stock and interest from buyers seeking low-maintenance living close to transit. Transaction activity has been well down, down 21.5% on the year, the lowest transaction count in five years.
Real estate agents in the Inner South have varied strengths across the riverfront enclaves and the growing transit corridor around Canning Bridge. This is a fragmented market, with the top 3 agents handling just 7% of sales over the past year. Their median sale of $1,150,000 sits 3.0% below the broader area median of $1,185,000, which can reflect the mix of homes they list. Their listings sold in a median of 47 days, 13 days slower than the area's typical 34 days, converting 67.6% of their listings into a successful sale, 3.2 percentage points behind the area's 70.8%.
The average commission rate is 2.08% (around $25,000 on a median-priced home). When selecting an agent, look beyond the commission rate. Compare their specific track record in your local area, their recent sales volume, and their experience with properties similar to yours. Receive a personalised shortlist of top agents in your local area from our agent comparison tool to sell more confidently.
Last Updated: June 2026
Why choosing the right local agent in Inner South matters
Not all agents deliver the same results. We've analysed local sales data from the past year to show exactly how much the top-performing agents outpace the market average in Inner South.
Sale price
Top agents achieved 1.2x higher prices than the Inner South average.
Days on market
The top 3 agents in Inner South sell 1.3x faster than the area average.
35
Days
Area avg.
28
Days
Top 3 agents
Compare Inner South real estate agents
Tools to help you choose the right agent in Inner South

SmartSearch
Find an agent you can trust, get the support you need
We've spent the last decade helping sellers connect with top-performing agents to sell their homes.

Commission Calculator
Get fee clarity by calculating average commission rates
Pay the right commission and maximise your sale price. Understand the average agent commission in your suburb.

Interview Guide
Interview potential agents with confidence
Ask the critical top ten questions that reveal experience, strategy, and trust, so you can select an agent with confidence.
(1) Auction clearance rate data has been sourced from Domain Insight.
Source: Copyright © 2026 Australian Property Monitors Pty Ltd trading as Domain Insight (DI). This information is published and compiled by DI and in developing it DI also relies on the information supplied by a number of external sources.

Customer service centre: 1800 817 616
For more information about our data sources and methodology, please see our Website Data Disclaimers.