OpenAgent Consumer Sentiment Report - 2017 Q4

Here at OpenAgent, we know the importance of up-to-date market insights. As Australia’s largest real estate comparison and referral platform, we speak to thousands of homeowners every month who are seeking assistance in selecting the right person to sell their largest financial asset.
We’re always looking for ways to add value for our customers, and we realised that by speaking with such a broad range of homeowners all over Australia, we had the unique ability to capture the market perspectives of one of the most important groups in the real estate ecosystem - home sellers.
In November 2016, we began compiling anonymised data capturing the sentiment and market expectations of consumers who were actively looking to sell their property.
This third quarterly release of the Report in January 2018 shows some fascinating developing trends in sentiment, based on a total of over 11,000 responses from property vendors across the last 14 months. As you’ll see below, this regular report includes home price sentiment at a National, State and Metro level, as well as granular information about why people are selling, and what they see as the key factors driving their local market. We hope you enjoy this report, and we look forward to delivering many unique insights in the quarters to come.
How the Consumer Sentiment Index Works
To build the Consumer Sentiment Index, we ask our vendors the following question: Where do you expect home prices to be in your area in six months’ time? Vendors then rank their answer on a 5 tier scale, ranging from Strongly Up, Slightly Up, About The Same, Slightly Down and Strongly Down. This information is then collated to provide the basis for our proprietary index system.
The index gives a measure of vendors’ expectations for home price movement on a scale of -10 to +10, with a reading of 0 being a neutral view of the market. Values above +5 indicate strong overall optimism and values below -5 indicate strong overall pessimism. Since the inception of the survey, over 11,000 OpenAgent customers from all across Australia have participated.
In 2017 Q3, we collected survey responses from a total of 2,919 OpenAgent customers. All of our responses have been weighted against the relevant cohorts at the state level to remove any bias and present a realistic snapshot of sentiment for that group. Using this methodology, we ensure that the Consumer Sentiment Index is relevant for all vendors, not just OpenAgent’s customers.
National Consumer Sentiment
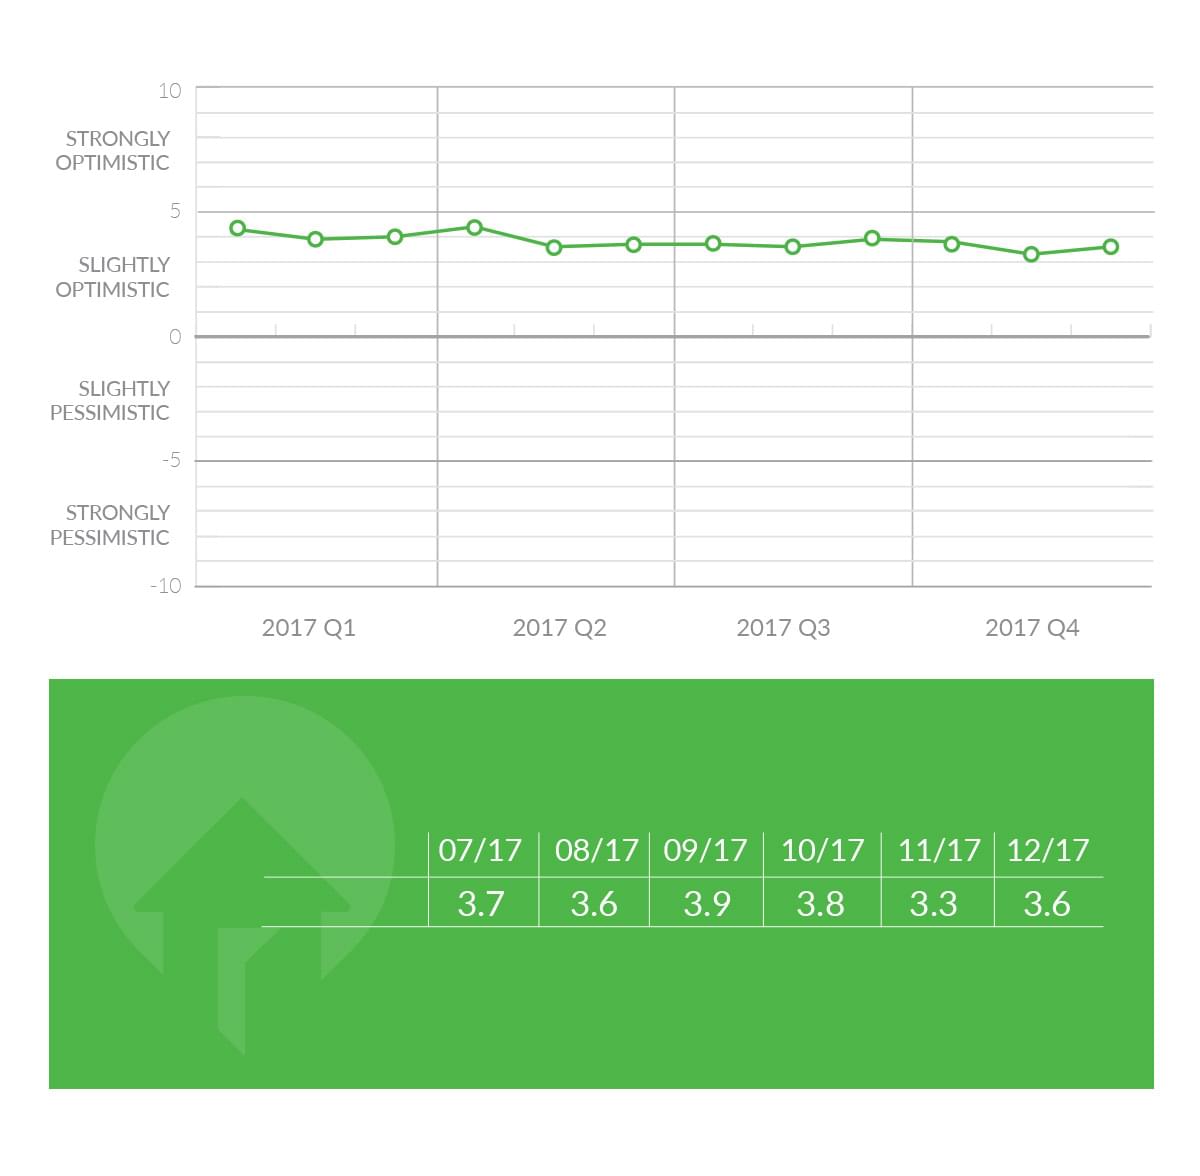
For 2017 Q4, national sentiment started out as a continuation of the prior quarter, with an index value of +3.8 in October 2017 following the +3.9 reading in September. The Australia-wide sentiment index then suddenly dropped to +3.3, its lowest point in the index’s history, in November 2017. The quarter finished with a bounce back to +3.6 in December 2017, though this was only equal to the previous lowest index value of August 2017. The drop in November is a warning sign that the heat is coming out of the property market in parts of the country.
State Consumer Sentiment
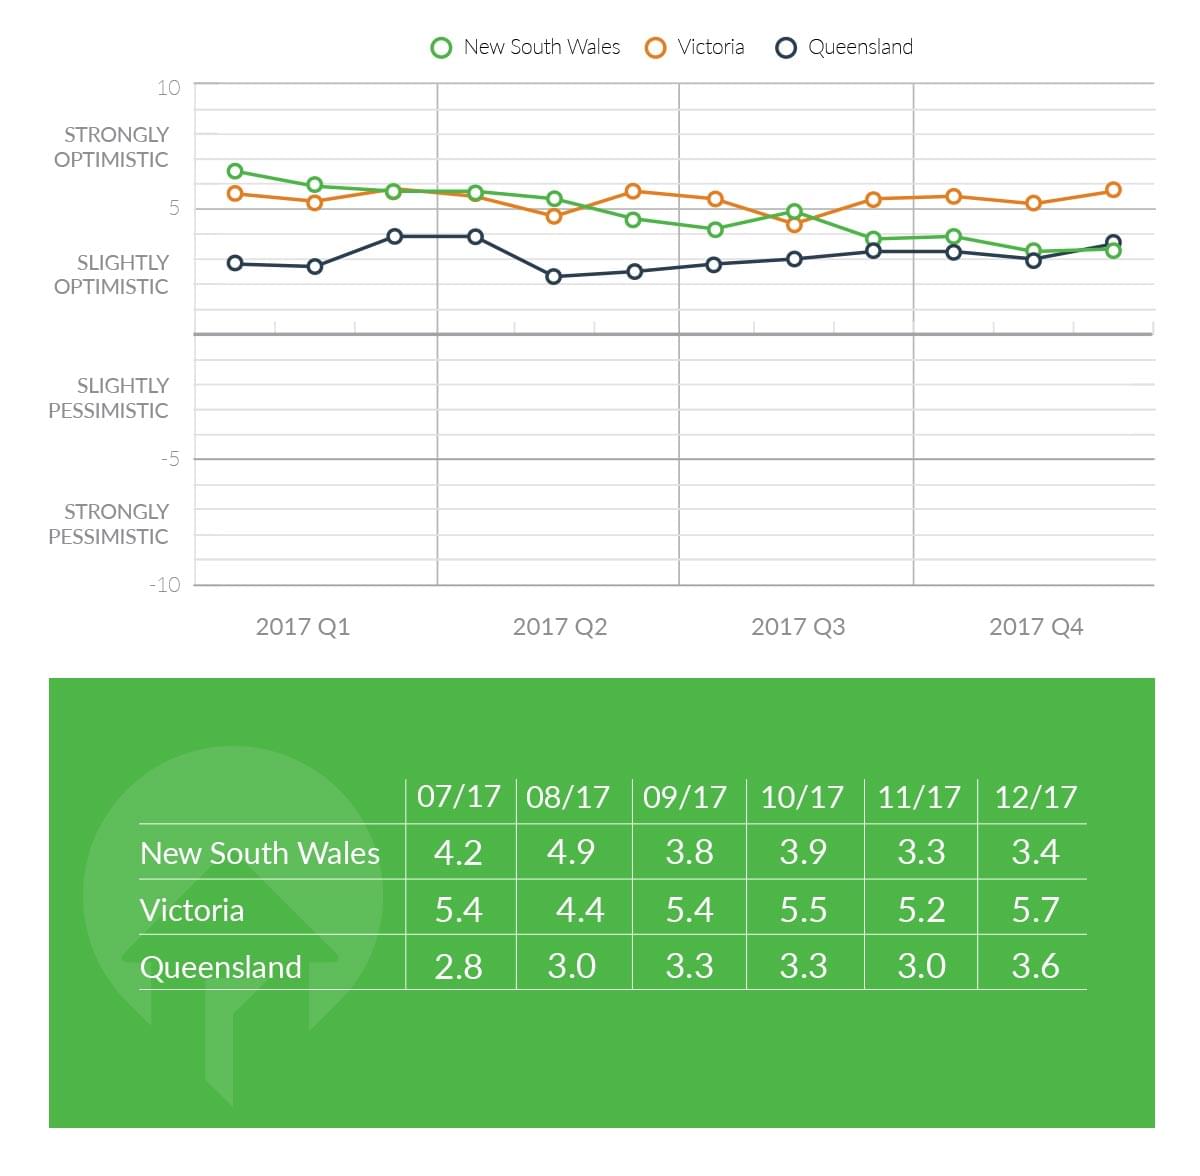
The decline in NSW sentiment already seen across 2017 persisted into Q4. Although the October index value of +3.9 was actually a slight improvement from +3.8 in September, the gains were short-lived. The rest of the quarter included index values of +3.3 in November and +3.4 in December, capping off a year that started with a +6.5 index value for NSW sentiment in January 2017.
The index has captured a fascinating turn in sentiment in the state that was once leading the nation in expectations for price growth. Although NSW sellers are not yet expecting prices to actually move downward, market realities in 2018 may well force them to change their views.
In Victoria, there is no downward trend during 2017 like in NSW, and it appears the fortunes of the two biggest property markets have clearly diverged in the eyes of sellers. The Q4 index values all clustered around the September value of +5.4. October produced a reading of +5.5, November was +5.2, and December was +5.7. Relative to the other states, Victoria’s sentiment has been quite stable, with no sign of a shift upward or downward.
Across the 12 months of Victorian sentiment index values in 2017, only two months had a reading outside the range of +5.2 to +5.8. The good-news story around the country can be found in Queensland, where sentiment is clearly on the rise. A slow but steady rise in index values from May to September led into Q4, which started with a +3.3 reading in October, unchanged from September. November brought a brief spike downward to +3.0 before December jumped up to +3.6, the highest value since April 2017. This means that December 2017 is the first time in the index when NSW sentiment was lower than QLD.
Metro vs. Regional Consumer Sentiment
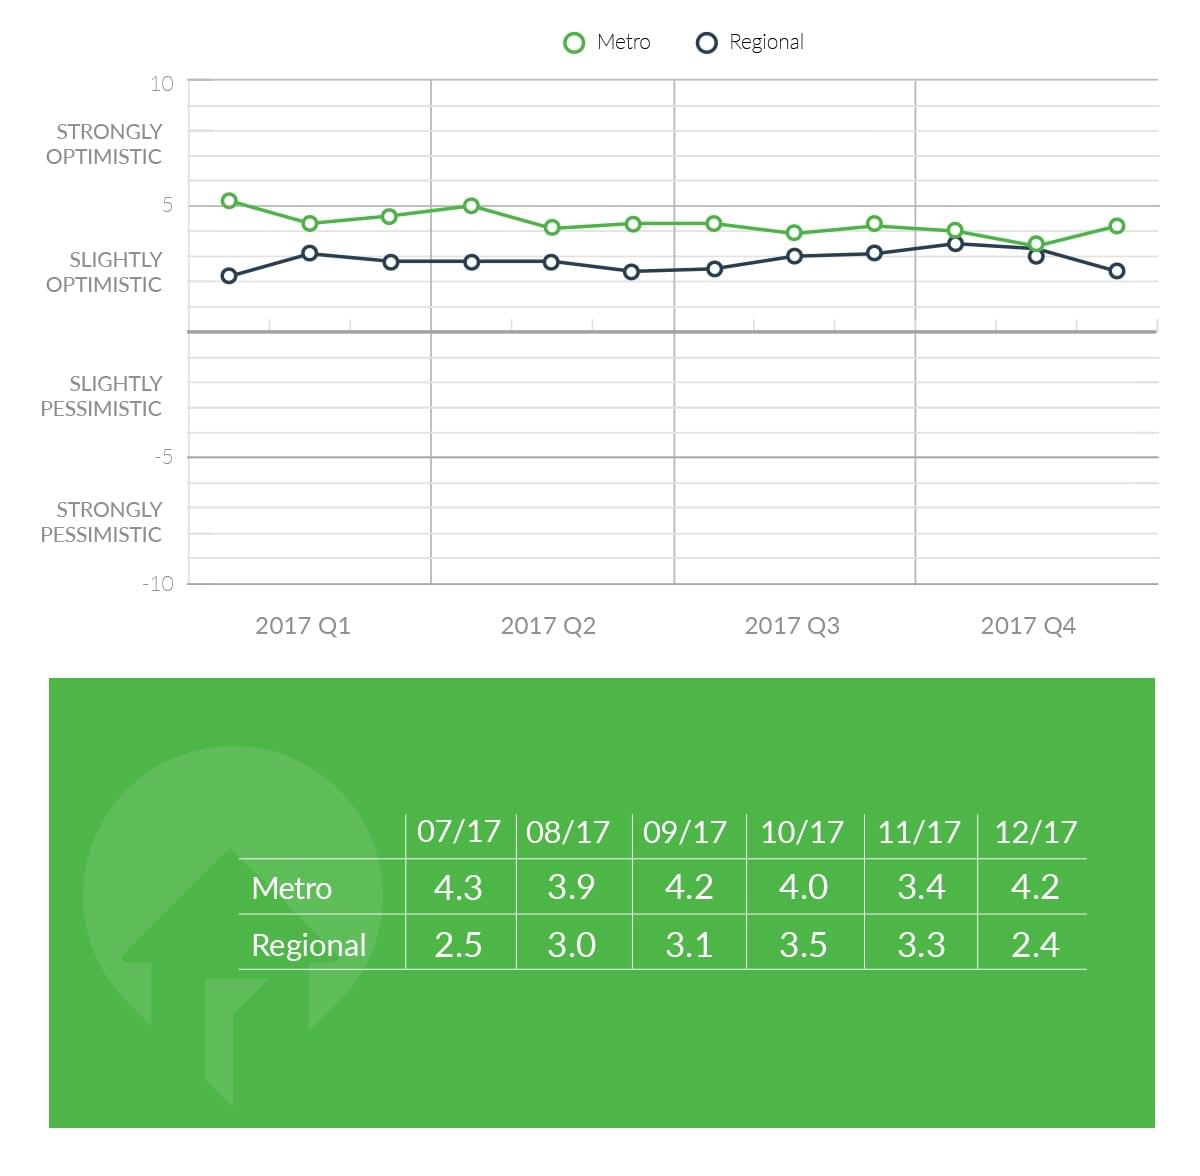
One of the more interesting outputs of the index is the difference in sentiment between metros and regional areas. The general situation during 2017 has been for metro areas to display more positive sentiment than regional areas, but Q4 provided some evidence that the situation may have changed.
In metros, sentiment was relatively steady across Q3, but some instability appeared in Q4. Index values of +4.0 in October and +4.2 in December contrasted with a reading of +3.4 in November, suggesting something briefly spooked metro sellers.
Regional areas were displaying a gradual positive trend across Q3, and the trend culminated in Q4 index values of +3.5 in October and +3.3 in November. The November value of +3.3, compared with the metro reading of +3.4 in the same month, was a powerful statement that the gap between metro and regional sentiment, formerly 3 points in 2017 Q1, was all but erased.
To finish the quarter, a surprising drop in regional sentiment to +2.4 in December leaves some doubt about the true state of sellers’ price expectations in regional areas at the end of 2017.
Capital Cities
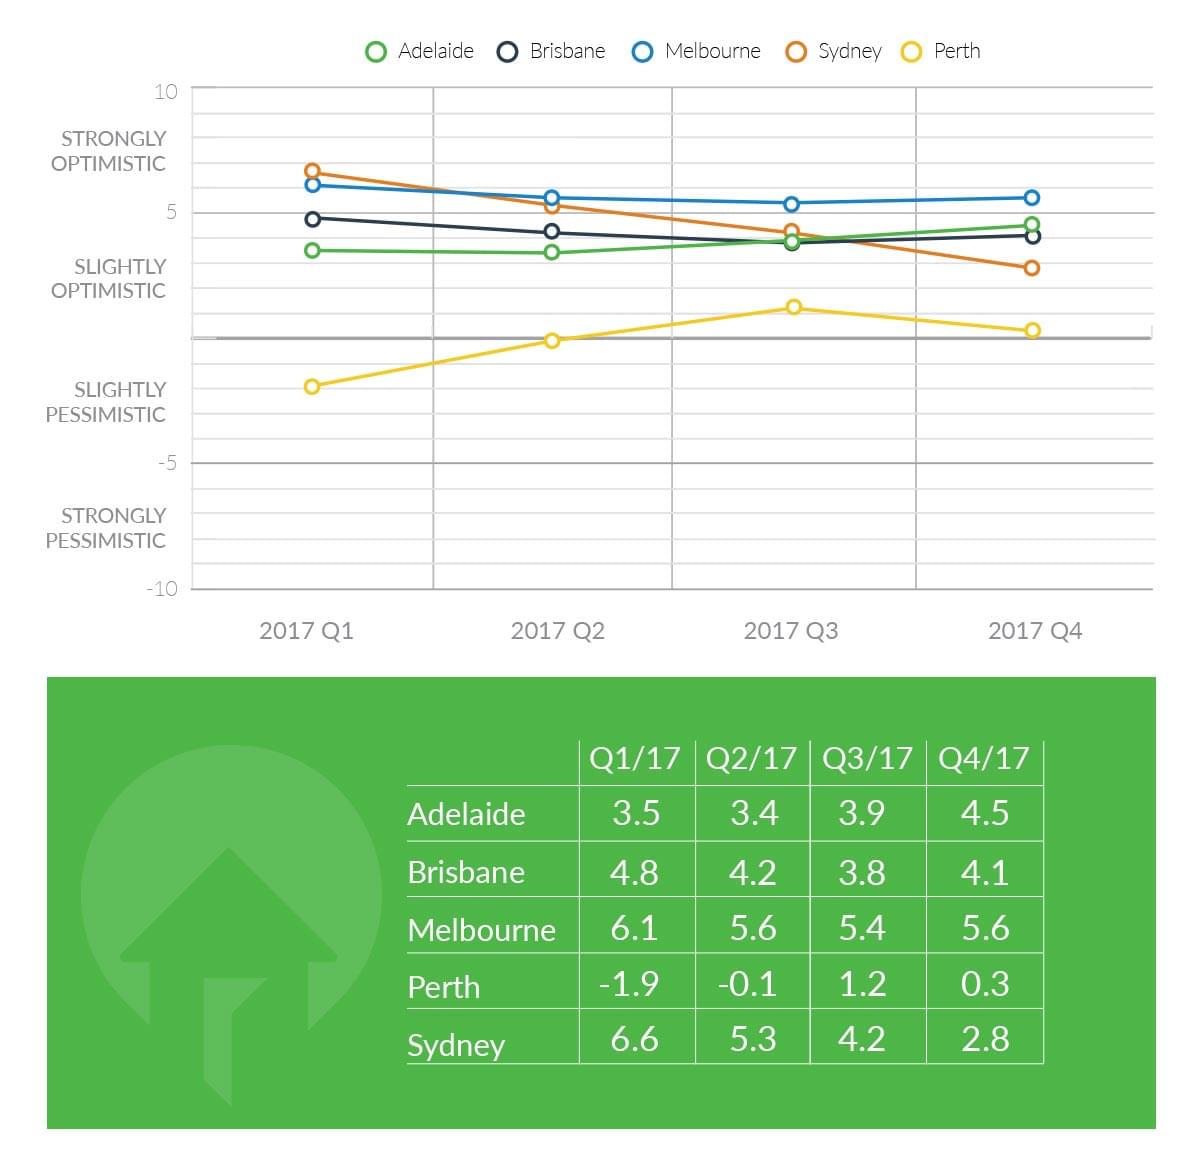
The state of property markets across the major metros of Australia looks very different at the end of 2017 than it did at the start of the year. Back in Q1, Sydney and Melbourne were riding big positive sentiment with index values over +6. Sydney has gone a totally different direction to Melbourne since then, with a Q4 index value of +2.8 versus Melbourne’s +5.6.
Adelaide has the most impressive positive sentiment trend among the capitals, with index values rising from +3.4 in Q2 to +4.5 in Q4. Brisbane dropped from +4.8 in Q1 to a low of +3.8 in Q3 before recovering somewhat to +4.1 in Q4.
Finally, Perth appeared to have turned a corner in Q3 with an index of +1.2, only to drop back to +0.3 in Q4. So at the end of 2017, with the exception of Perth, the other metros have realigned on their relative sentiment, leaving much uncertainty about where prices will go in 2018.
Investors vs. Owner Occupier Sentiment
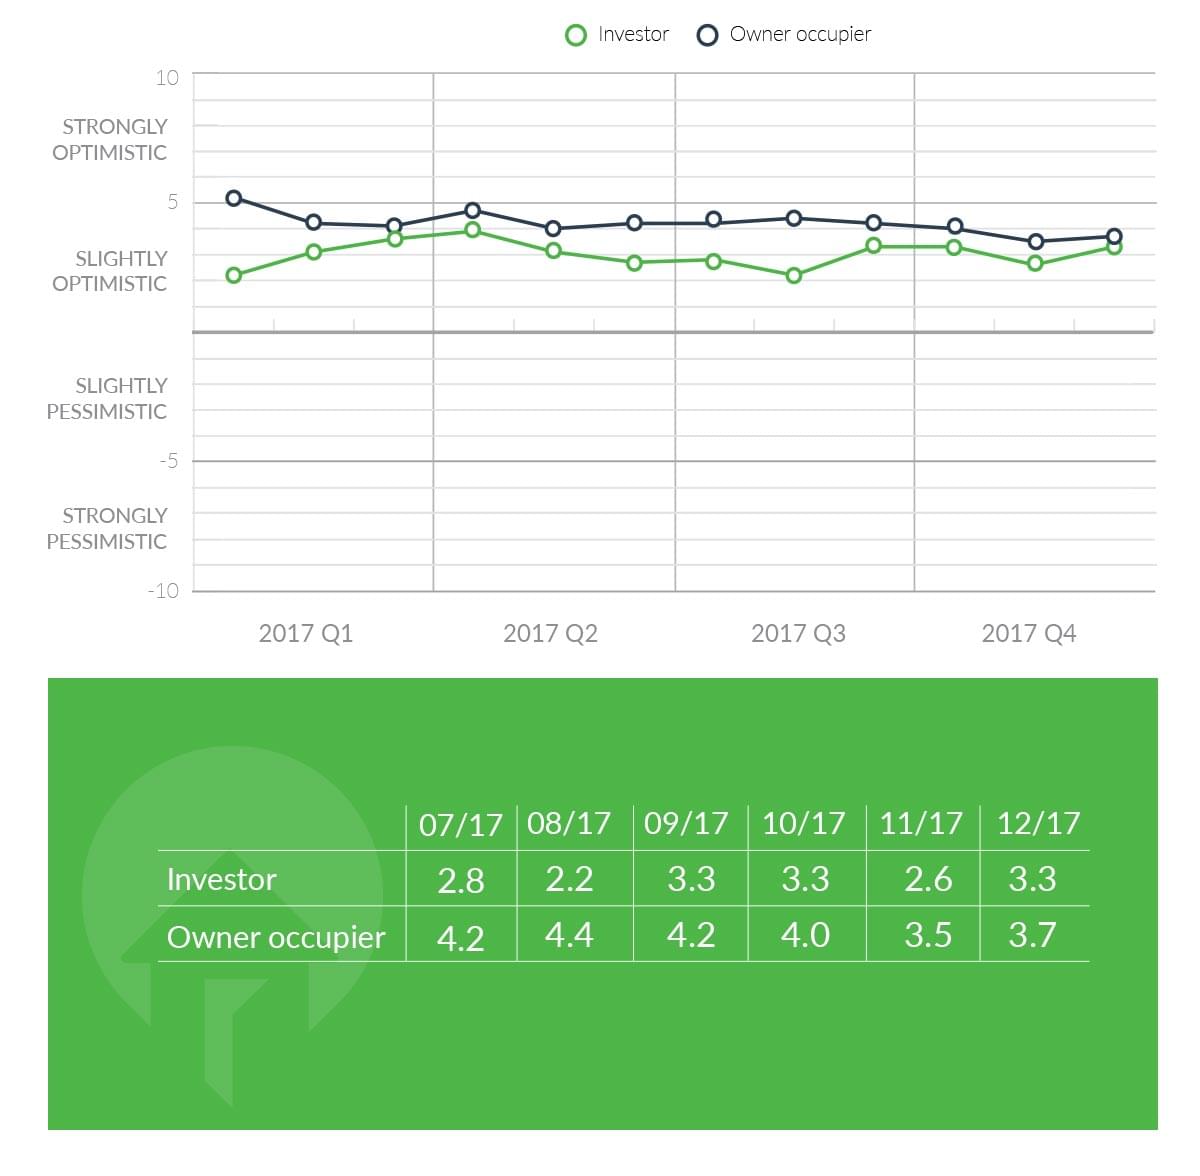
Throughout 2017, the sentiment of sellers has varied by whether they are owner-occupiers or investors, and Q4 provided some interesting changes to the dynamic. Owner-occupiers have generally had more stable sentiment, with index values between +4.0 and +4.4 between May and October.
However, the last two months of 2017 showed that owner-occupiers’ views may be changing, as their index dropped to +3.5 in November and +3.7 in December, the lowest readings for the year.
Investors’ sentiment has been harder to read, with large swings across months and quarters, and Q4 was no different. The index opened the quarter at +3.3 in October, dropped to +2.6 in November, and jumped right back to +3.3 in December.
The difference between sentiment of owner-occupiers and investors may be more notable, with investors generally being slightly less optimistic than owner-occupiers. This gap reached a maximum of 3.0 points in January and another extreme of 2.2 in August, but narrowed to a much smaller difference of 0.4 in December.
Highlight: Greater Sydney Trends
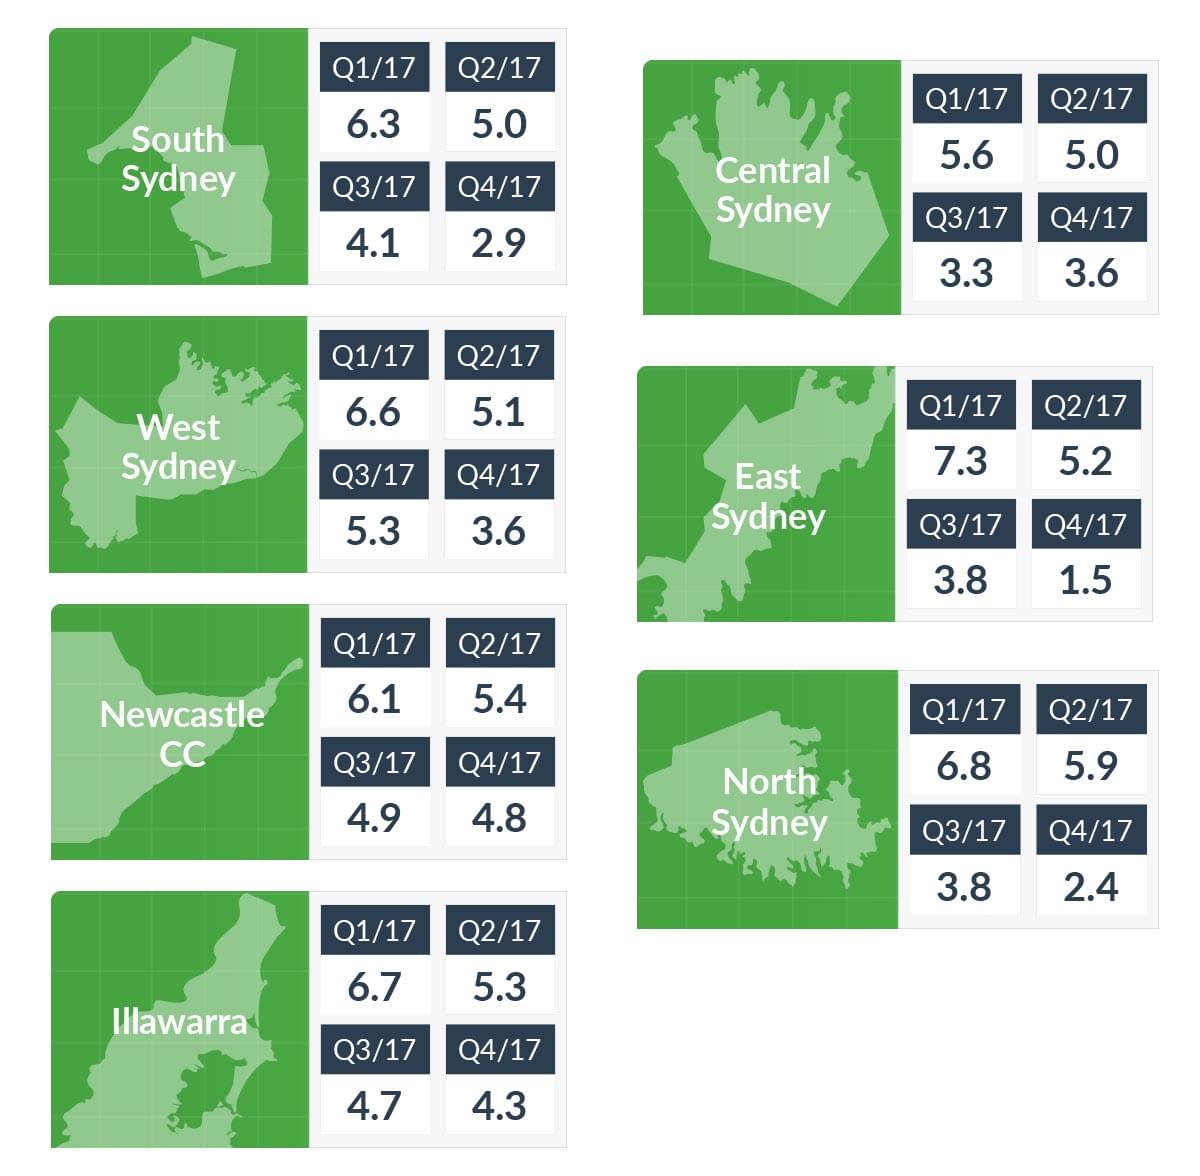
This Q4 report takes a special look at the Greater Sydney area, which has seen a huge downward change in sentiment from the beginning to the end of 2017. It’s clear that Sydney sellers are sensing a big turn in the market, but the interesting thing is that the changes aren’t felt equally across Sydney.
Some interesting patterns emerge when splitting Sydney into geographical areas. At the start of 2017, the most positive price expectations according to index values were in Sydney’s east (+7.3) and north (+6.9). However, by Q4 Sydney’s east (+1.5) and north (+2.4) had completely flipped to having the lowest sentiment index values in Greater Sydney, with huge index drops of 4-6 points.
Sydney’s south also dropped significantly during the year from +6.3 in Q1 to +2.9 in Q4. On the other hand, the central and west areas held up relatively better, dropping only by 2-3 points and ending the year with index values of +3.6 in both areas.
The brightest spots for sentiment in the Greater Sydney area were actually outside of Sydney. The two adjacent regional areas of Newcastle/Central Coast and Wollongong/Illawarra started 2017 with strong price expectations as shown in index values over +6.
Despite the greater sentiment declines elsewhere in Sydney, these two areas had relatively better sentiment at the end of 2017, finishing Q4 with index values of +4.8 in Newcastle/Central Coast and +4.3 in Wollongong/Illawarra, higher than anywhere else in Greater Sydney.
This would seem to be a strong statement from sellers that they think the boom is winding down in Sydney metro but that price growth is still coming outside the metro.