OpenAgent Consumer Sentiment Report - 2018 Q2

Here at OpenAgent, we know the importance of up-to-date market insights. As Australia’s largest real estate comparison and referral platform, we speak to thousands of homeowners every month who are seeking assistance in selecting the right person to sell their largest financial asset.
We’re always looking for ways to add value for our customers, and we realised that by speaking with such a broad range of homeowners all over Australia, we had the unique ability to capture the market perspectives of one of the most important groups in the real estate ecosystem - home sellers.
In November 2016, we began compiling anonymised data capturing the sentiment and market expectations of consumers who were actively looking to sell their property.
April 2017 saw the inaugural release of the OpenAgent Consumer Sentiment Report, an ongoing quarterly publication that will track the market expectations of active vendors over time.
The latest installment of this report, covering sentiment from April until the end of June 2018, shows some fascinating developing trends in sentiment across Australia, based on a total of over 22,279 responses across 20 months.
As you’ll see below, this regular report includes home price sentiment at a National, State and Metro level, as well as granular information about why people are selling, and what they see as the key factors driving their local market.
We hope you enjoy this report, and we look forward to delivering many unique insights in the quarters to come.
Sincerely yours, Zoe & Marta Co-Founders of OpenAgent
How the Consumer Sentiment Index Works
To build the Consumer Sentiment Index, we ask our vendors the following question: Where do you expect home prices to be in your area in six months’ time? Vendors then rank their answer on a 5 tier scale, ranging from Strongly Up, Slightly Up, About The Same, Slightly Down and Strongly Down.
This information is then collated to provide the basis for our proprietary index system. The index gives a measure of vendors’ expectations for home price movement on a scale of -10 to +10, with a reading of 0 being a neutral view of the market.
Values above +5 indicate strong overall optimism and values below -5 indicate strong overall pessimism. In 2017 Q2, we collected a total of 2,556 survey responses from OpenAgent customers all across Australia. All of our responses have been weighted against the relevant cohorts at the state level to remove any bias and present a realistic snapshot of sentiment for that group.
Using this methodology, we ensure that the Consumer Sentiment Index is relevant for all vendors, not just OpenAgent’s customers.
National Consumer Sentiment
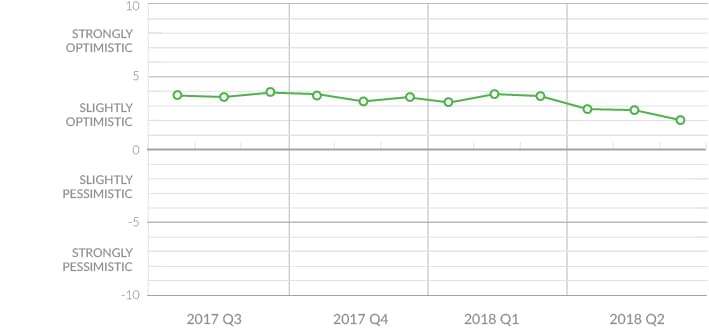
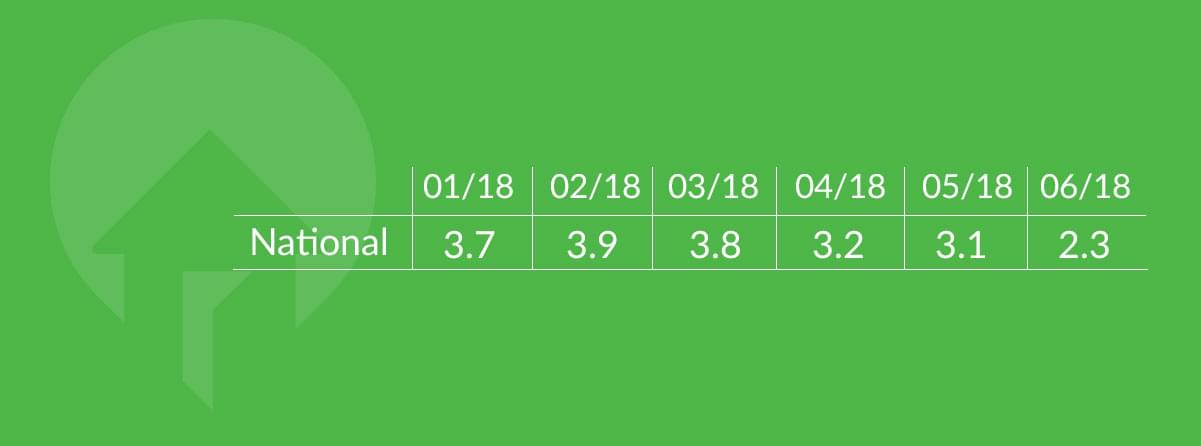
For 2018 Q2, national sentiment started out lower than the previous quarter, falling to +3.2 points in April from +3.8 in March.
May saw a sentiment score of +3.1 and by June, it had dropped to +2.3, which is the lowest point in the index’s history. This fall reflects what is now known to be a turn in the housing market over the first half of 2018.
State Consumer Sentiment
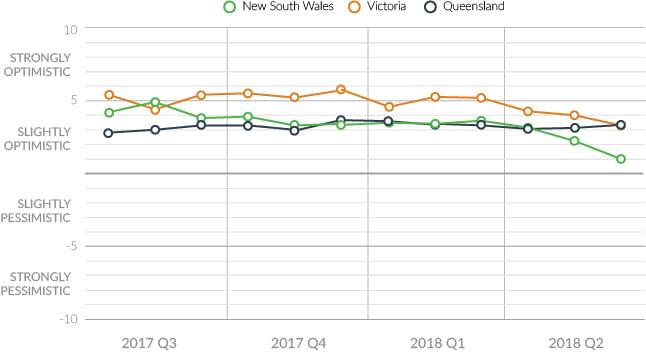
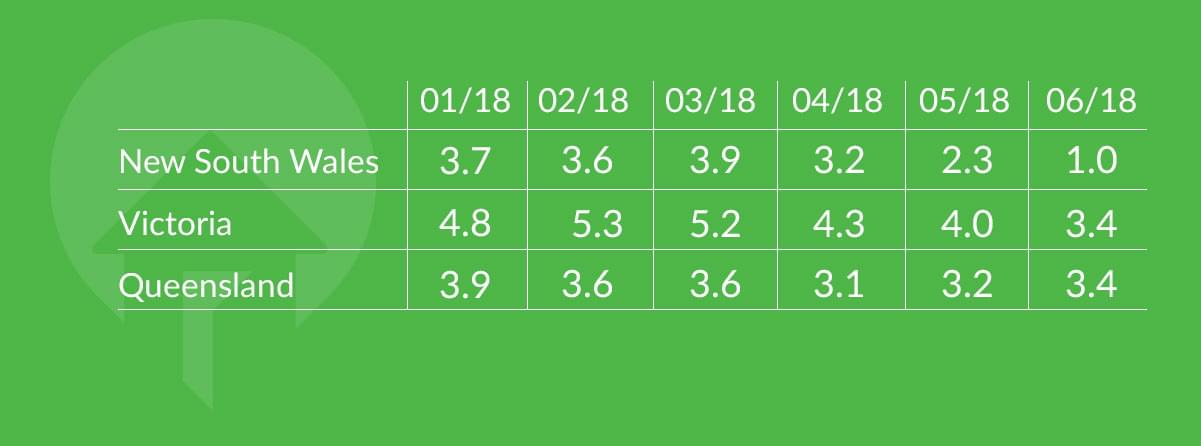
OpenAgent’s consumer sentiment index has mapped a steady decline in NSW seller confidence after a peak in 2017. In Q1 2018, index values (+3.7, +3.6 and +3.9) showed a slight improvement as we moved into a new year.
However as we moved into Q2 2018, NSW saw the largest drop in sentiment score, dropping from +3.9 in March to +3.2 in April. It took another tumble in June, where it dropped to a low of 1.0. This is in stark contrast to the NSW index value of +6.5 that we saw in January 2017.
NSW was once taking the lead in terms of expectations for price growth, but in June 2018, NSW has recorded the lowest state index value in Australia for the period the index has been recorded.
In Victoria, index values began to turn in Q2 2018, with a drop from +5.2 to in March down to +4.3 in April. Sentiment fell again in June, dipping to a low of +3.4 - the lowest sentiment in Victoria since November 2016.
This decline is similar to the results in NSW, however, the drop has been delayed by a quarter signalling that there may be more negative sentiment to come as we move throughout the year and as 2018 comes to a close.
Queensland has continued to remain strong, with the index staying relatively stable at +3.1, +3.2 and +3.4 - a strikingly different trend in comparison to NSW and Victoria where the index has turned. Year on year, the index for Queensland has been steadily increasing, signalling a confidence in the price of property in the state.
In Western Australia we see a dip in consumer sentiment after a peak in February and March at around +2.2. This has since dropped down to an average of +1.1 for the June quarter. This level is still much more positive than the average index value of 0 that we saw in November and December of 2017.
Metro vs. Regional Consumer Sentiment
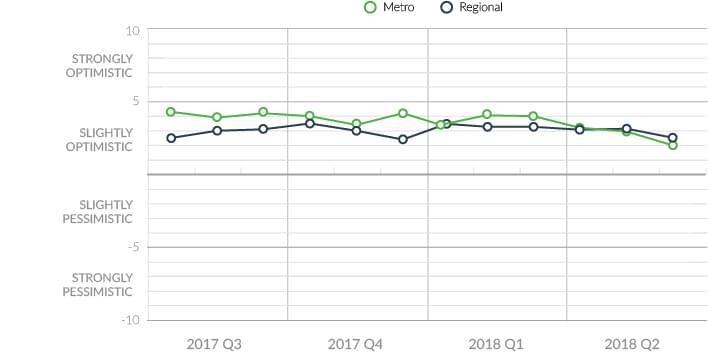
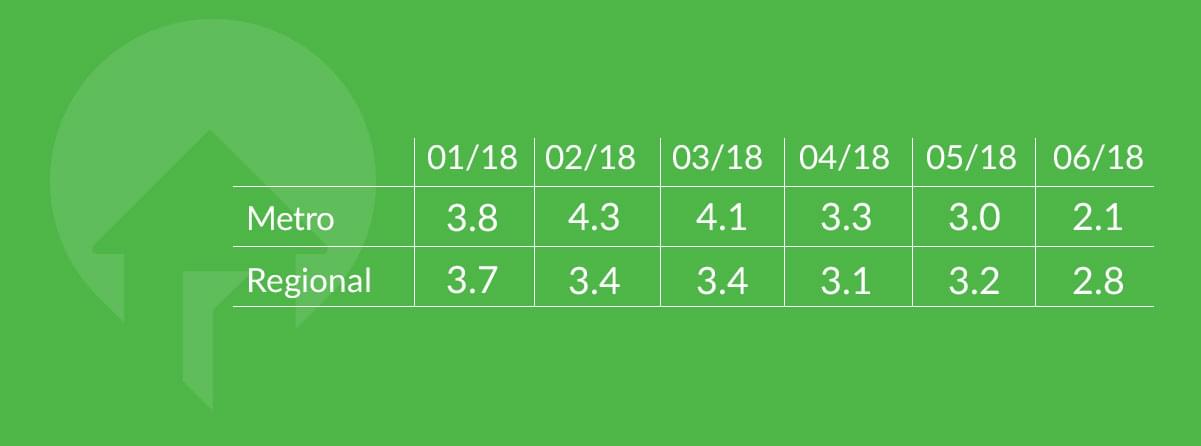
Metro regions have seen the most significant turns in sentiment, with the index falling from +4.1 in March to +2.1 in June across all metro markets. This is reflective of what we see in the nation’s two largest markets, Sydney and Melbourne, where clearance rates have dipped due to actions to taken by banks to squeeze credit.
Regional areas have surprisingly held steady over Q2 2018, with consumer sentiment only slightly lower from +3.4 in March to +2.8 in June. This reinforces that the price correction in housing is more likely to affect areas where prices have grown exponentially over the past decade.
Capital Cities
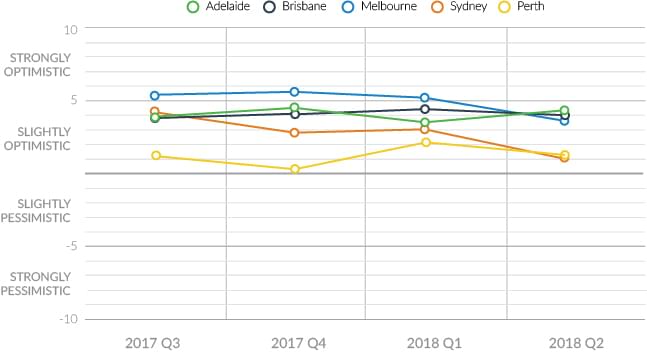
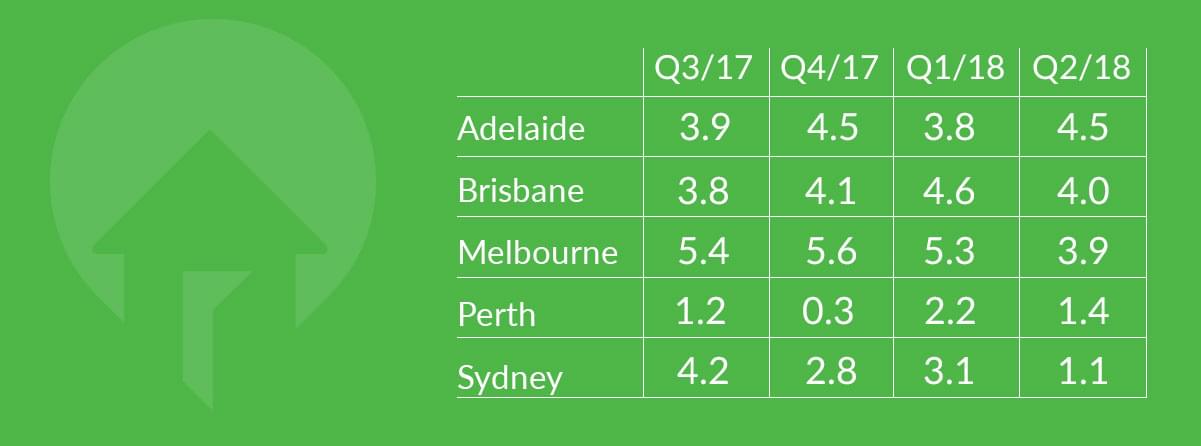
The state of property markets across the major metros of Australia, Sydney and Melbourne look quite different midway through 2018 compared to the same time in 2017, with Brisbane and Adelaide markets being the only cities that haven’t recorded a significant change.
Sydney and Melbourne drove negative sentiment during the second quarter of the year, with Sydney falling from +3.1 to +1.1, which has been the largest quarterly drop in two years. To put this into further content, Sydney was once riding a positive index value of +6.6 in January of 2017.
In Q2 2018, Melbourne had only begun to turn with the index falling from +5.3 in January down to +3.9 in April. This shift confirms the first turn for the property market in Sydney and Melbourne in the past decade.
Sentiment across other major cities is still holding strong, with Adelaide actually improving slightly, increasing from +3.8 in Q1 up to +4.5 in Q2. Sentiment in Brisbane and Perth have remained stable, with no significant increases either up or down.
Investors vs. Owner Occupier Sentiment
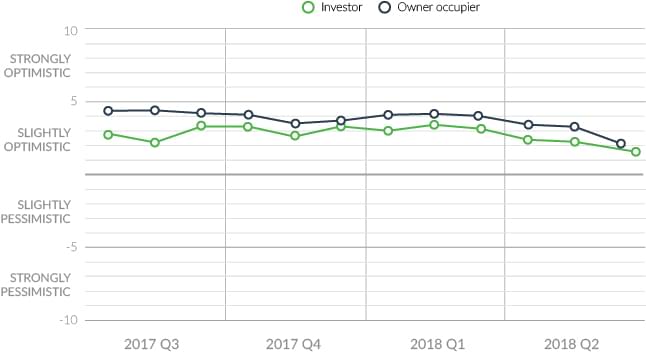
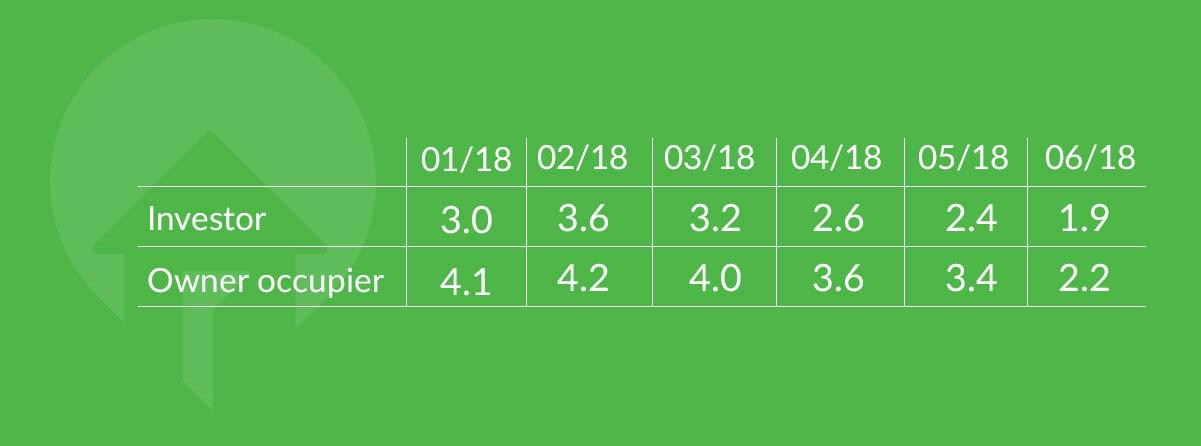
Throughout 2017 and 2018, the sentiment of sellers has always varied depending on whether they are investors or owner occupiers, with owner occupiers generally being a little more optimistic.
The difference between sentiment of owner-occupiers and investors in April 2018 was 1.0 points. The sentiment of both groups continued to trend downwards throughout the quarter, with owner-occupiers reporting an index value of +2.2 and investors +1.9.
This is the lowest owner-occupier and investor sentiment we have recorded in the past two years. It’s interesting to note that the gap in sentiment between these two groups had narrowed to 0.3 points by June 2018. This would suggest that investors and owner-occupiers are moving towards a similar outlook of the market.
Highlight: Greater Sydney trends
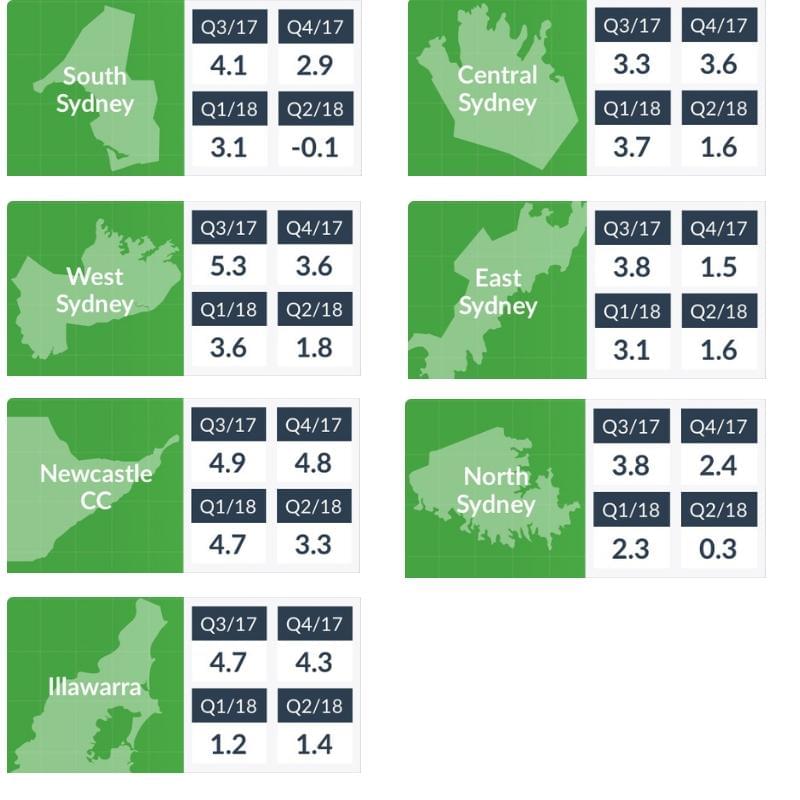
Our index takes a special look at the Greater Sydney area, including Newcastle/Central Coast and the Wollongong/Illawarra region. By the end of 2017 it was clear that the majority of Sydney sellers were sensing a big turn in the market, with Sydney’s east being a prime reflection of this, dropping from an index value of +7.3 in January down to +1.4 by October.
When we look at values recorded for Q2 2018 across Sydney, we see that sentiment has generally continued to drop, especially in Sydney’s North, which dropped further from an index value of +2.3 in January, down to +0.3 in April.
South Sydney’s sentiment dropped even more dramatically, from +3.1 in January down to -0.1 in April. This downward trend seems to be a reflection that sellers are quite clearly facing the midst of a cooling market.
Was there a good news story in Greater Sydney? Over the last few quarters, as seller sentiment dropped across Sydney we saw that Newcastle/Central Coast and Wollongong/Illawarra ended 2017 with higher sentiments than anywhere else in Sydney.
While seller outlook continues to be more positive in these regions, sentiment values are continuing to drop, with Newcastle/Central Coast recording a low of +3.3 in April, down 1.4 points from +4.7 in January 2018, and Wollongong/Illawarra sellers recording an index value of +2.5, down 1.1 points from Q1 2018.
While sentiment in these regions had clearly been more optimistic than Sydney, the index values of Q2 2018 seem to indicate that sellers are expecting that the cooling of the market seen across Sydney will have a ripple effect on markets in Newcastle, the Central Coast, Wollongong and the Illawarra.