Australian property market update - July 2019

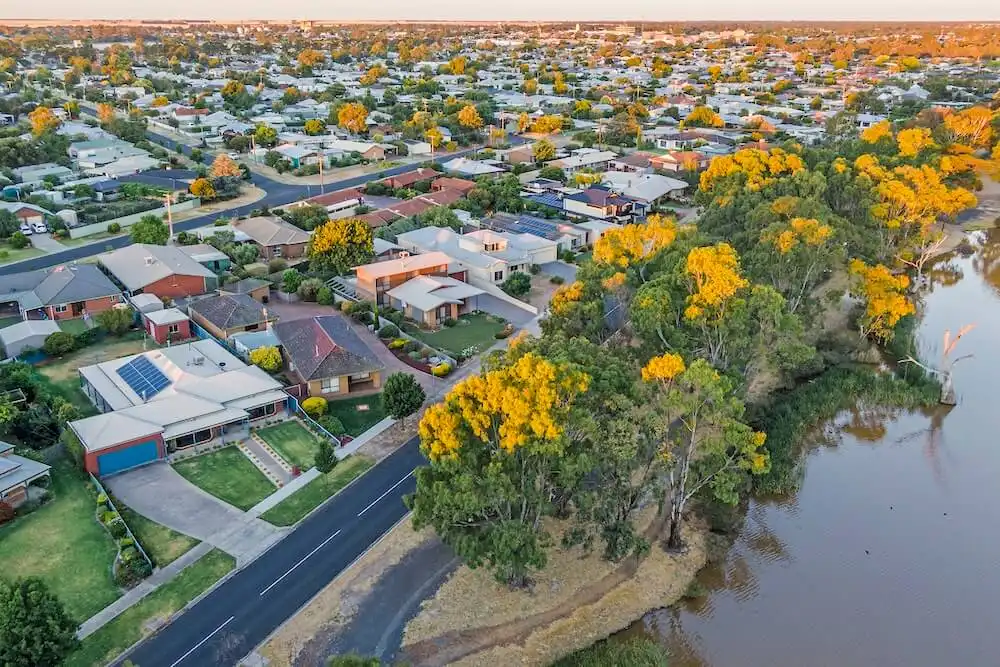
As we move past the midpoint of 2019 and into the depths of winter, let's take a look at how national property values are tracking, and if they are bucking the trend set by temperatures outdoors.
The overall trend has been a slowing of the slide, with national values down -0.2% in June, the smallest month-on-month slide in property prices since March 2018. According to CoreLogic, July saw five of the eight capitals post a slight rise in values, though national dwelling values are still flat over the month.
What is behind this subtle though significant turnaround - which has seen a series of smaller month-on-month declines? The recent election win for the Liberals, together with increased credit availability, tax cuts and lower interest rates all would appear to have put a spring back into the step of Aussies.

National property values: July 2019

Houses
$530,812
Monthly change: 0%
Units
$484,904
Monthly change: +0.2%
The best performing capitals over July have been Darwin (+0.4%) and Hobart (+0.3%), along with Australia's two largest cities, Sydney and Melbourne both up +0.2%. Perth continues to struggle, down -0.5% for an annual drop of -8.9%.
There is some positivity in regional markets with parts of South Australia, Tasmania and the Northern Territory also up in July. Overall it is our two biggest markets - Sydney and Melbourne - which are driving the turnaround. Here dwelling values are up +0.3% in Sydney and +0.4% in Melbourne over June/July.
Crucially auction clearance rates have been consistently above 70% for most of July across much of Sydney and Melbourne. In terms of rental yields, however, rents were down for the combined capitals -0.1% in July, with Sydney, Perth and Canberra all recording falls.
Market update: Sydney and regional NSW
Houses
$864,993
Monthly change: +0.2%
Units
$685,619
Monthly change: +0.3%
As we have mentioned, overall Sydney dwelling values are staging a renaissance, up +0.2% in July and units up +0.3%. Over the quarter, however, Sydney house values are still down -0.2%.
Some areas of Sydney are also still in the doldrums with the South West (-10.5%) and Inner South West (-13%) still hurting - these figures are the average change in dwelling values.
Regional areas also feeling the pain, including the Illawarra (-11%) and Newcastle area (-8%), though the Riverina is up +5.6% for the year. Sydney still has the lowest yielding rental market of all the capital cities at 3.43%.
Market update: Melbourne and regional VIC
Houses
$710,151
Monthly change: +0.1%
Units
$530,923
Monthly change: +0.4%
Like Sydney, the Victorian capital is showing signs of life with units up a noticeable +0.4% in July, with houses a little more muted with a +0.1% rise. The demand for units is a reflection of continued migration to Melbourne, with buyers keen to snap up property that has been languishing on the market for much of 2018 and the first half of this year.
Areas that continue to struggle in Melbourne include the Outer East (-11%) and Inner South (-9%). Regional Victoria is a mixed picture with Geelong down -4.5% over the year, with Bendigo up +2.4% over the same timeframe.
Market update: Brisbane and regional QLD
Houses
$533,295
Monthly change: +0.3%
Units
$372,495
Monthly change: +0.1%
Positive numbers for the Queensland capital, with Brisbane houses up +0.3% over July and units +0.1% - the first lift since November '18.
Overall the market is down -0.8% for the quarter and -2.4% for the year - with a median dwelling price of $484,998. Markets in mining towns in Outback Queensland are still in freefall down -36.2% over the year, with little prospect for recovery - though overall regional markets are stable at 0.0% in July.
Market update: Hobart and regional TAS
Houses
$482,044
Monthly change: +0.3%
Units
$374,169
Monthly change: +0.3%
Hobart continues to perform well with houses and units up +0.3% in July alone, thanks to a continued shortage of housing. This means the Tasmanian capital has posted a respectable annual growth of +2.8% - with the South East of the island up +7.5%, and the West/North West +6.5% - the highest annual capital gains recorded across the country.
Rents are also on the rise in Hobart, up 5.5% over the past year.
Market update: Canberra and the ACT
Houses
$657,686
Monthly change: -0.3%
Units
$423,464
Monthly change: -0.5%
Canberra has experienced an overall fall of -0.3% for houses and -0.5% for units, though the market is up +1.1% overall year to date. The median house price is currently $657,686, while units are at $423,464. Gross rental yields are currently 4.8% in Canberra, a figure that is unchanged from 2018.
This market is expected to recover for the latter half of 2019 and into the new year, given the consistent demand for rental properties in the nation's capital.
Market update: Adelaide and regional SA
Houses
$461,651
Monthly change: -0.3%
Units
$321,506
Monthly change: -0.8%
Unit prices have slumped further in Adelaide (-0.8%) reflecting continued uncertainty in the local economy, with houses also falling -0.3%, - taking state dwelling values down overall -1.3% year to date.
Parts of Adelaide (North) are positive +0.8% for the year, but markets in some regional areas (Outback) are still in the doldrums (-6.8%).
Market update: Perth and regional WA
Houses
$459,227
Monthly change: -0.5%
Units
$349,084
Monthly change: -1.1%
Perth is also the worst performing capital city in the three months to July, down -2.2%, with some suburbs (South East) down -10.2% on an annual basis. This is largely due to the lacklustre performance of the local economy.
Regional areas are mixed with the Wheatbelt down -17% with Outback areas -20.3%. Here, drought is the main drag on property prices, not to mention the local economy of these rural heartlands. On a positive note rental yield are up to 4.3% in Perth, up from 3.9% in 2018.
Market update: Darwin and regional NT
Houses
$472,467
Monthly change: +0.6%
Units
$289,369
Monthly change: +0.1%
Darwin is in pole position for July when it comes to price growth for houses, gaining +0.6% and units marginally up +0.1%. The median price of units in the NT capital sits at just $289,369 in July 2019.
Regional NT has also seen some growth over the year, with dwellings up +2.9% for Outback areas. Rents, however, have dropped -4.0% in Darwin (-4.0%), though gross rental yields are still at a healthy 5.9% - the highest in the country.

What does all this mean and what can we expect?
Analysts are split what the green shoots mean for the national property market. Although national house prices were still trending lower across most states in 2019, the downturn does appear to be easing, and in some markets gains are being recorded. Some Sydney and Melbourne postcodes are looking positive, after a lull that has lasted two years.
HSBC Chief Economist Paul Bloxham believes the housing market is starting to stabilise, and could even grow in 2020. This is based on rising consumer confidence and auction clearance rates - a sure barometer of activity in local markets. This view mirrors our own Consumer Sentiment Report for Q2 2019, which records rising national consumer sentiment after a year long decline.
It's a little early to predict a market recovery but there is cause for guarded optimism, and only time will tell what the data looks like come 2020.