Australian property market update - June 2019
Learn more about our editorial guidelines.
As the first month of winter rolled around, analysts have been watching the housing market to see if it will continue to cool along with the weather outside. In spite of this, there are some signs that the market is carving its own trend, with a slower overall rate of decline and even a slight rise in the price of dwelling values in Sydney and Melbourne.
May's market update pointed towards an ease in the rate of decline for some markets relative to the previous quarter. With a new month has come two crucial developments: the federal election results and the Reserve Bank's interest rate cuts - both of which are factors that look to be spurring optimism in the market moving forward.

National Property Values
Houses
$530,317
Monthly change: -0.2%
Units
$481,724
Monthly change: +0.1%
According to CoreLogic's latest figures, national house values fell -0.2% in June, which marks the smallest month-on-month slide in property prices since March 2018. It should be noted that the decline of -0.4% recorded for May was also the smallest month-on-month decrease for the same period, a trend that should come as a blessing to investors and homeowners alike.
In the last month, both Sydney and Melbourne experienced an increase in their dwelling prices, 0.1% and 0.2% respectively. This is especially notable since neither capital city has experienced growth since their peaks in mid-late 2017. However, the nation's two most populous cities weren't the only ones to steal the limelight - Hobart also recorded a 0.2% increase, largely driven by strong apartment sales.
National dwelling values fell -0.2% in June, which marks the smallest month-on-month slide in property prices since March 2018.
Over the last quarter to June, all capital cities have experienced an overall decline in dwelling values. Despite this, the best performing capital city was Adelaide sliding just -0.4%, while the hardest hit was Darwin which suffered a loss of -3.6% to dwelling values over the period. Dwelling values in regional South Australia and regional Tasmania both recorded a rise over the quarter, with +0.6% and +1.3% respectively.
Market update: Sydney and regional NSW
Houses
$866,524
Monthly change: 0%
Units
$682,374
Monthly change: +0.3%
Sydney dwellings overall experienced a 0.1% increase, driven solely by the increase in unit prices over the last month. Although this increase may be modest, it will come as welcome news to Sydney investors as it marks the first of its kind since the city's dwelling prices peaked in July 2017. Rental yields in Sydney have remained low, the lowest of any other capital city, however, they have increased by 0.3% in the last year to 3.5%.
Despite the good news, four sub-regions of Sydney including Sutherland (-10.5%), Outer South West (-11.7%), Inner South West (-13.9%) and Ryde (-14.1%) placed in the bottom 10 nationwide for annual performance.
Compared to Sydney, regional NSW did not see the same growth through June, with overall dwelling prices decreasing by -0.3% to $442,291. Riverina, however, ranked third highest for annual performance to June with 6.4% growth.
Market update: Melbourne and regional VIC
Houses
$709,092
Monthly change: +0.1%
Units
$527,748
Monthly change: +0.5%
Overall dwelling prices in Melbourne increased by 0.2%, a figure also driven by growth in unit prices. The last time dwelling values rose in Melbourne was in November 2017 - this news may be a welcome sign that the worst of the housing crisis is over for the city. Rental yields in Melbourne remain low like Sydney, but have still increased by 0.5% in the last 12 months to 3.7%.
Regional Victoria, however, didn't see the same figures, with an overall slide of -0.6% and a new combined dwelling price of $357,840. Despite this, four of the top ten highest performing sub-regions can be found in the area, including Bendigo (2.3%) and Ballarat (2.5%).
Market update: Brisbane and regional QLD
Houses
$464,266
Monthly change: -0.5%
Units
$322,598
Monthly change: -1.0%
Dwelling values in Brisbane fell by -0.6% in June, reaching $486,121 while regional Queensland only dipped -0.2% to $367,241.
It should be noted, however, that the Outback region of Queensland recorded a staggering drop of -32.67% to dwelling prices in the last year, which can largely be attributed to extreme weather conditions. Also in the last 12 months leading up to June, Brisbane recorded a 0.2% increase in rental yields from 4.4% to 4.6%.
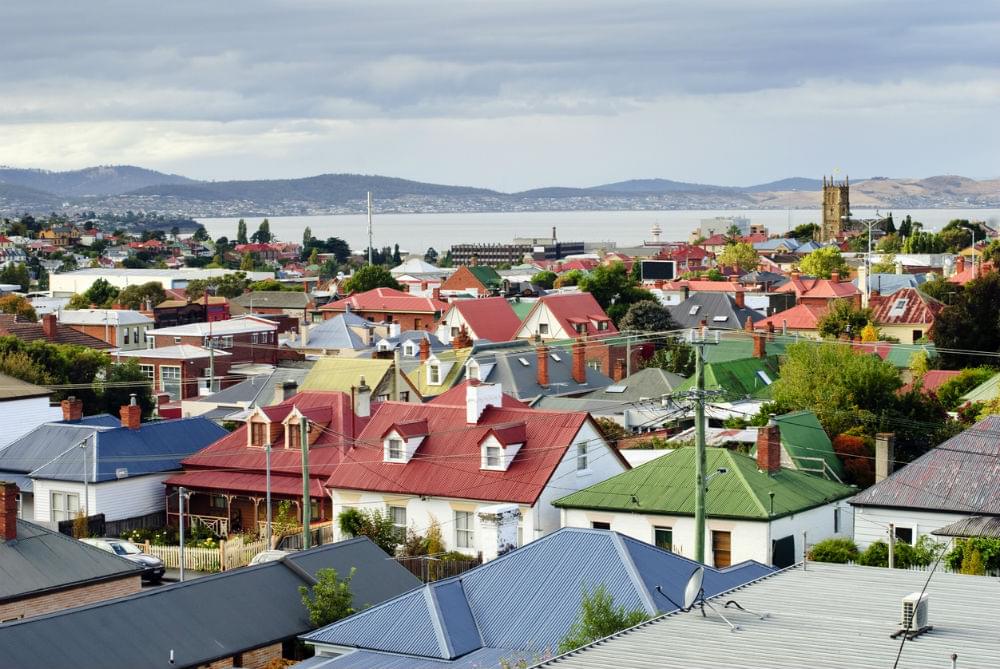
Market update: Hobart and regional TAS
Houses
$484,716
Monthly change: +0.1%
Units
$370,599
Monthly change: +0.5%
Overall dwelling prices in Hobart rose 0.2% to $453,033, driven by an increase in unit sales. Rental yields have remained relatively stable in Tasmania's capital, increasing only 1% in the last 12 months up to 5.2%.
Dwelling values in regional areas, on the other hand, fell by -0.2% reaching $294,705. It should be noted though that regional unit values increased considerably by 5.7%, with the median price hitting $236,431. Australia's best performing regional markets over the past 12 months have been in Tasmania - specifically the South East (7.7%) and West and North West (6.4%). However, the strong momentum built up over the years seems to be slowing down.
Market update: Canberra and the ACT
Houses
$656,943
Monthly change: -0.9%
Units
$433,049
Monthly change: -0.8%
Dwelling prices in Canberra fell by -0.9% this month to $585,193. This was driven by similarly slow performances for both houses and apartments as seen above. Aside from the poor performance this month, ACT has performed well over the last year, with a 1.5% increase in dwelling price as well as a 0.3% increase in gross rental yields.
Market update: Adelaide and regional SA
Houses
$465,266
Monthly change: -0.5%
Units
$322,598
Monthly change: -0.4%
Adelaide dwellings reached a median price of $430,654 in June, marking a decrease of -0.5% with similar performances across houses and units. On a quarterly basis, Adelaide recorded the smallest decline amongst all capitals, with values decreasing only -0.4%. Adelaide's rental yields have increased 0.1% over the last year to June.
Comparatively, dwellings in regional SA areas actually achieved a small increase of 0.1%, with the median house price reaching $237,509. This is largely due to an lift in the performance of units, which increased by 1.6% to $181,555.
Market update: Perth and regional WA
Houses
$458,137
Monthly change: -0.7%
Units
$345,754
Monthly change: -0.9%
Combined dwelling prices continued to decrease in Perth by -0.7%, reaching $439,732 by the end of June. Over the last three months, Perth also recorded the second largest overall fall at -2.1%. But it's not all doom and gloom as rental yields in Perth have increased from 4% to 4.3% within the last year.
Not much of the same can be said for regional WA as dwelling values fell -1.5% month-on-month to $304,192. Interestingly enough though, units in regional WA actually showed a considerable increase of 6.8%, with prices hitting $221,236. Despite this, a -2.0% lull in housing values still brought the combined average down.
Market update: Darwin and regional NT
Houses
$461,030
Monthly change: -1.7%
Units
$289,109
Monthly change: +0.5%
Dwelling prices increased fell overall by -0.9%, to $387,382. Regional NT saw a slight boost in dwelling prices of 0.2%. This was driven by strong performances in property prices, which rose 1.4%, reaching $417,674. On a quarterly basis, Darwin has recorded the largest fall with -3.6%. However, it also recorded the highest rental yield over the quarter at 6.0%.
Rental listings and clearance rates
Rental yields have increased in all capital cities, except for Sydney and Canberra which dropped -0.3% and -0.9% respectively in the last quarter. Over the same period rents, have increased by just 0.3% this quarter, down significantly from the 1.0% increase recorded in the first quarter of the year. In fact, the annual change in combined capital city rents remains at an all-time low.
Auction clearance rates have been improving over the last quarter, particularly in Sydney and Melbourne where they have been holding above 60% throughout June. This is sure to inspire optimism as it was only late last year when clearance rates were frequently in the low 40% range. Clearance rates for all capital cities are up, except for Brisbane, Canberra and Perth which currently still linger in the 40% and below range.
What does this all mean and what can we expect?
On the whole, June has shown that there is a lot to be optimistic about. Improving conditions - largely the slowing pace of decline earlier in the year - indicates that the market is on the mend.
Many analysts are optimistic and believe that the market on large will continue to bottom out over the remainder of the year, with a recovery set for 2020.
It's a little early to predict any kind of market rebound but many analysts are optimistic and believe that the market on large will continue to bottom out over the remainder of the year, with a recovery set for 2020. It's important to keep in mind that each area can vary significantly and may not necessarily follow the national trends.
Despite this, the sentiment brought on by the federal election and the confidence boost of interest rate cuts will only further guide these promising signs in the right direction.


