Property boom continues in May after market resurgence
Learn more about our editorial guidelines.
Property prices across Australia rose in value by +2.2 per cent in May according to CoreLogic's latest national home value index.
That's a notable acceleration from April's increase of +1.8 per cent, which many tipped to signify a slowing of the market after March's historic +2.8 per cent surge.
So what are the factors at play that are driving this seemingly relentless forward momentum?
National property values: May 2021
| Median property value | Monthly change | |
| Houses | $668,532 | +2.4% |
| Units | $563,204 | +1.5% |
The +2.2 per cent boost in national values means the median home price is now $634,355, a touch under a $10,000 jump from last month.
That amounts to an annual increase of +10.6 per cent, meaning that, going by the median numbers, selling a property now would net over $60,000 more than it would have 12 months ago.
Tim Lawless, CoreLogic's research director, notes that the breadth and extent of the growth being seen is far from common.
"Values were up by more than +1 per cent across every capital city over the month, with both house and unit values lifting across the board," he says.
"Of the 334 SA3 sub-regions analysed by CoreLogic, 97 per cent have recorded a lift in housing values over the past three months.
"Such a synchronised upswing is an absolute rarity across Australia’s diverse array of housing markets."
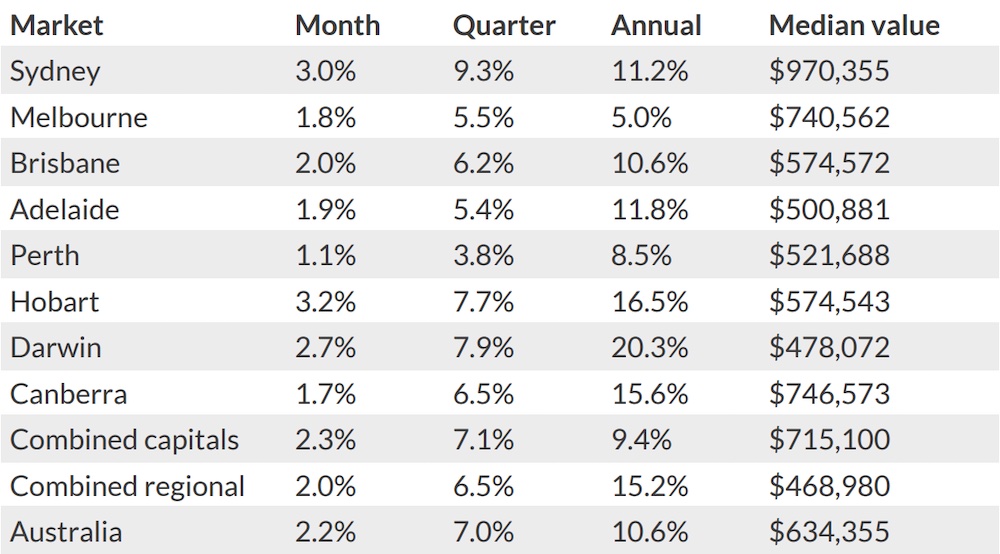
In terms of the strongest performers, Hobart continued its blistering run with values soaring a further +3.2 per cent in May, and Darwin wasn't far behind on +2.7 per cent.
Sydney was up a further +3.0 per cent, hitting a breathtaking +9.3 per cent increase for the quarter and the median home price is less than $30,000 shy of the $1 million milestone.
The Brisbane, Adelaide, Melbourne and Canberra markets all made significant progress—they were up +2.0, +1.9,+1.8 and +1.7 per cent respectively.
Perth was the only capital to lag behind the rest of the pack to some degree, amounting to a +1.1 per cent uptick in May.
Regional areas turned in more mixed results this month, with regional NSW, Tasmania, QLD and Victoria all contributing healthy growth figures around the +2.0 per cent mark while SA and WA both hovered right around nil.
The top end of the market is surging
When CoreLogic reported median home values around Australia had grown by +1.8 per cent in April in contrast to the seismic +2.8 per cent jump seen in March, many saw it as a sign that the market was cooling and growth would continue to ease.
The May figures have shown momentum shift back the other way, though, and this time it's the market's top end that's slammed on the accelerator.
"The underlying trends have shifted over the past year," Mr Lawless explains.
"The most expensive end of the market is now driving the highest rate of price appreciation across most of the capital cities, whereas early in the growth cycle it was the most affordable end of the market that was the strongest."
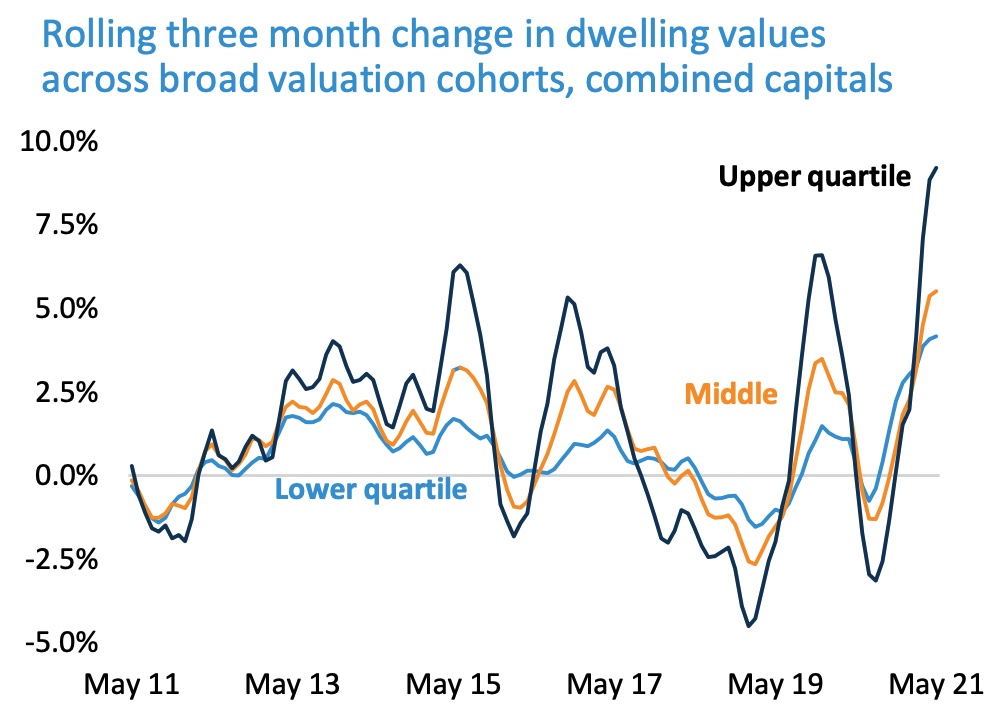
When looking at the combined capitals, the upper quartile of the market (ie. the top 25 per cent most valuable properties) increased in value by +9.2 per cent over the quarter. By comparison, the lower quartile grew by +4.2 per cent.
The report notes that the effect is most pronounced in Sydney and Melbourne where housing affordability is a widening problem at lower price points.
Fortunes are flipped in Hobart and Darwin, however, where homes in the most accessible price points have been steaming ahead at around the +10 per cent mark for the quarter.
Investor activity is increasing
This past year the action has been dominated by first home buyers and owner-occupiers, with Mr Lawless pointing out in another CoreLogic article that 76 per cent of all new home loans in the 12 months to March were taken out by that segment of buyers.
But over the past six months, the value of investor loans have increased by close to 50 per cent, and now in dollar terms investors and owner-occupiers are neck and neck.
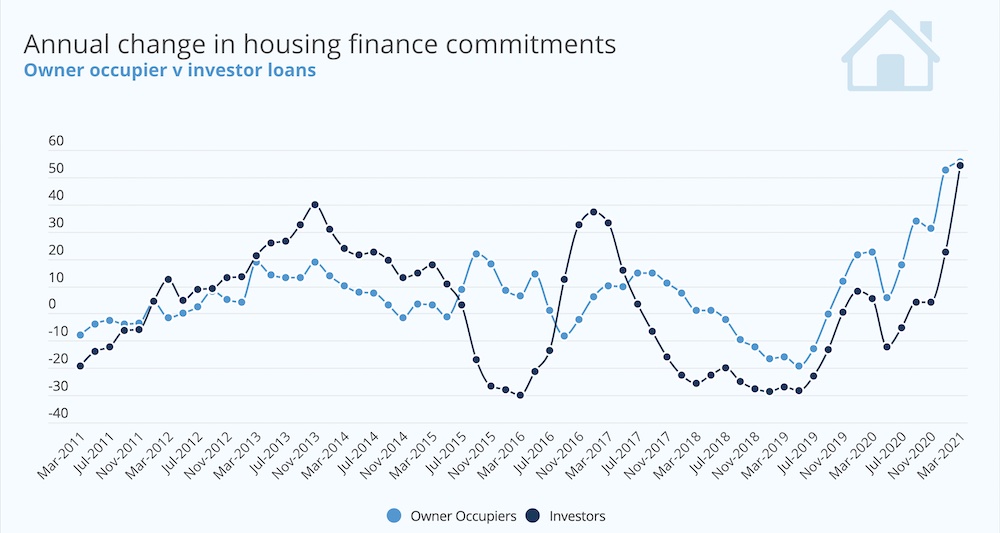
Mr Lawless explains that the rising challenges around affordability are hitting first home buyers the hardest, while investors are better equipped to capitalise on the market's bullish conditions.
Sydney and NSW in particular are where investors are focusing on most, which he says "may seem a little counter-intuitive" due to record high prices and low rental yields.
Capital gains is where Sydney shines brightest, though, and for those prioritising longer-term sale profits over more immediate cash flow, it's so far proving to pay dividends.
Darwin and regional Tasmania have also seen major increases in capital gains on houses, clocking +24.5 and +24.4 per cent over the past 12 months respectively.
Units in regional Victoria and regional Queensland have also shown strong returns of +19.3 and +16.9 per cent respectively, showing that there are major opportunities for investors around Australia.
NAB's personal banking boss Rachel Slade told the Australian Financial Review that "some of the uncertainty is coming out of the investor mindset and they are more confident."
As a result, she says the bank has "seen investor interest come back, and we have definitely seen investor applications start to really lift."
Capital cities are beginning to outpace regional areas
CoreLogic's latest regional market update concludes Australia's regional markets have grown at double the rate of capital cities over the past 12 months—regional areas are up +13.0 per cent year on year as opposed to +6.4 per cent growth for the capitals.
The tables have turned in recent months though, and over the past three months, capital city growth has pulled ahead.
In fact, every capital outperformed its home state in May, in some cases by a wide margin.
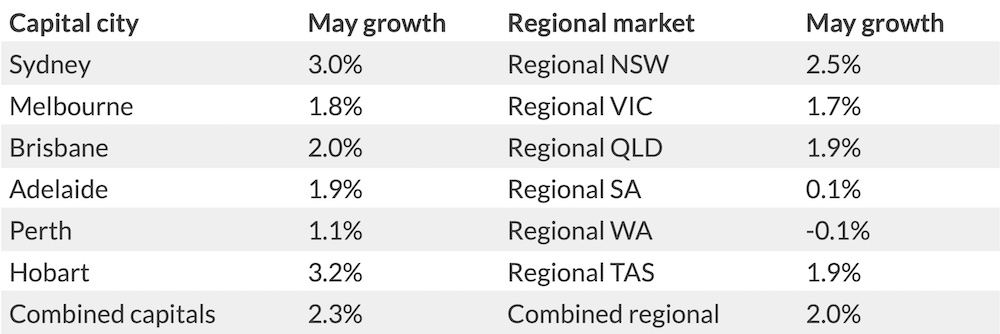
Regional NSW has remained particularly sprightly, with prices pushing on another +2.5 per cent, and regional Queensland, Tasmania and Victoria all approached the +2.0 per cent level.
South and Western Australia struggled, however, where median values remained more or less the same as they were a month ago.
Where last year saw regional markets surge as people flocked to lower density lifestyle areas, the improved capital city growth can be partly attributed to extended periods of relative calm as far as Covid outbreaks are concerned.
The impact of the current Melbourne lockdown, with the endpoint still unknown, remains to be seen.
Stock is still low and demand is still high
As has been the case throughout this year's boom, supply is still falling well short of demand.
New figures from SQM Research show total property listings around the country dropped by -6.3 per cent in May when compared to April, as homes are being snapped up by buyers faster than new listings can come on the market.
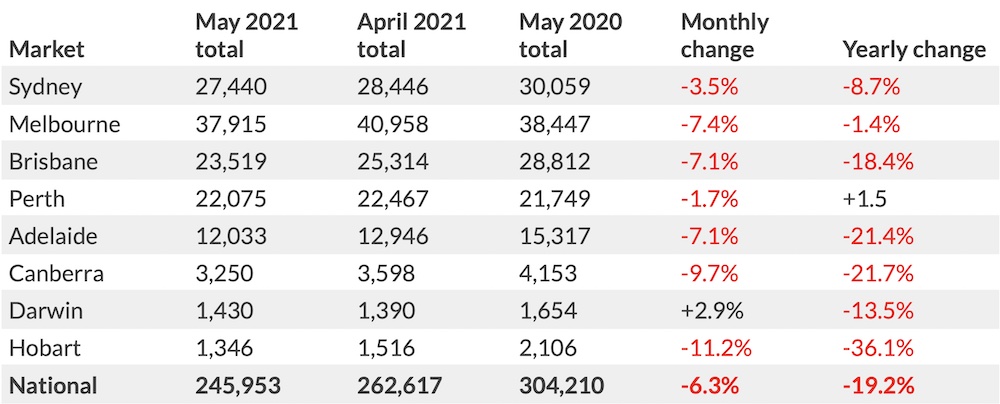
They note that total listings are now down -19.2 per cent nationwide compared to 12 months ago, with Hobart, Adelaide, Canberra and Brisbane recording the biggest falls.
CoreLogic explains this imbalance of supply and demand is resulting in auction clearance rates remaining high in May—still in the mid-to-high 70 per cent range—while the days on market figure continues to hover around the record low of 25 days.
"The sales to new listings ratio remains around 1.1, meaning for every new listing there is more than one sale occurring," Mr Lawless says.
"As a consequence, vendors remain in a strong selling position while buyers have a weak position at the negotiation table."
Essentially, the dynamic we've seen play out so far in 2021, where buyers are having to compete more fiercely over the decreasing stock on the market, is still very much in play.
Where is the market heading?
April's dip in growth left a question mark over whether or not market conditions would ease, but May's strong performance seems to have put that concern at bay for the time being.
CoreLogic notes that "the reduction in federal government fiscal support seems to have had little to no impact on housing demand or growth in home values to date," adding that "housing values are still currently rising faster than the peak rate of growth in recent cycles."
The Reserve Bank of Australia's June announcement, while noting that factors like unemployment and wage growth are improving faster than expected, is holding firm on its message that interest rates are still not expected to rise until 2024.
With listings remaining low, demand riding high and investor activity rising, it seems there's more upward movement to come.
The CoreLogic home value index report concludes "we are expecting housing values will continue to rise throughout 2021 and into 2022, albeit at a gradually slower pace.
"Domestic demand should continue to be supported by the expectation that mortgage rates will remain at their record lows for some time, as well as the ongoing high levels of consumer confidence as the economy expands at a faster than average pace."


