Market activity update during Covid-19
Samantha is a Sydney-based real estate and home improvement writer. She is currently Head of Marketing at OpenAgent.
Learn more about our editorial guidelines.
Since Covid-19 started impacting the market in March of this year, opinions around what is going to happen have been varied, with some economists projecting price increases, and some projecting price falls.
With so much uncertainty, there's a need to focus on what is happening right now, rather than predicting what will happen in the future - the fact is, with Covid-19, no-one can be certain.
As we all continue to move through these uncharted waters, the best thing we can do is provide you with recent numbers and facts, and how you can use these kinds of numbers to inform your decisions moving forward.
Below you’ll find some high-level data and insights around transaction volumes and how long it’s taking on average to sell a home across Australia.
Sales volume at a national level
At a national level, sales volume is about 30% lower than it was this time last year. This is an improvement compared to March, where we saw about a 34% drop.
National sales volume compared to 2019
-30%
Sales volume is currently -30% lower compared to the same time last year, however has improved since the end of March.
While we haven’t yet seen the full V-shaped market recovery we were all hoping for, we can see that sales numbers started recovering right after the Easter holidays, and by mid-June transaction volumes had been rising about 3% week on week.
Even though volume is showing a marginal upward trend over the last two months, it’s expected to maintain or dip slightly in July due to lockdown restrictions being reintroduced in Victoria.
Which states are leading the charge?
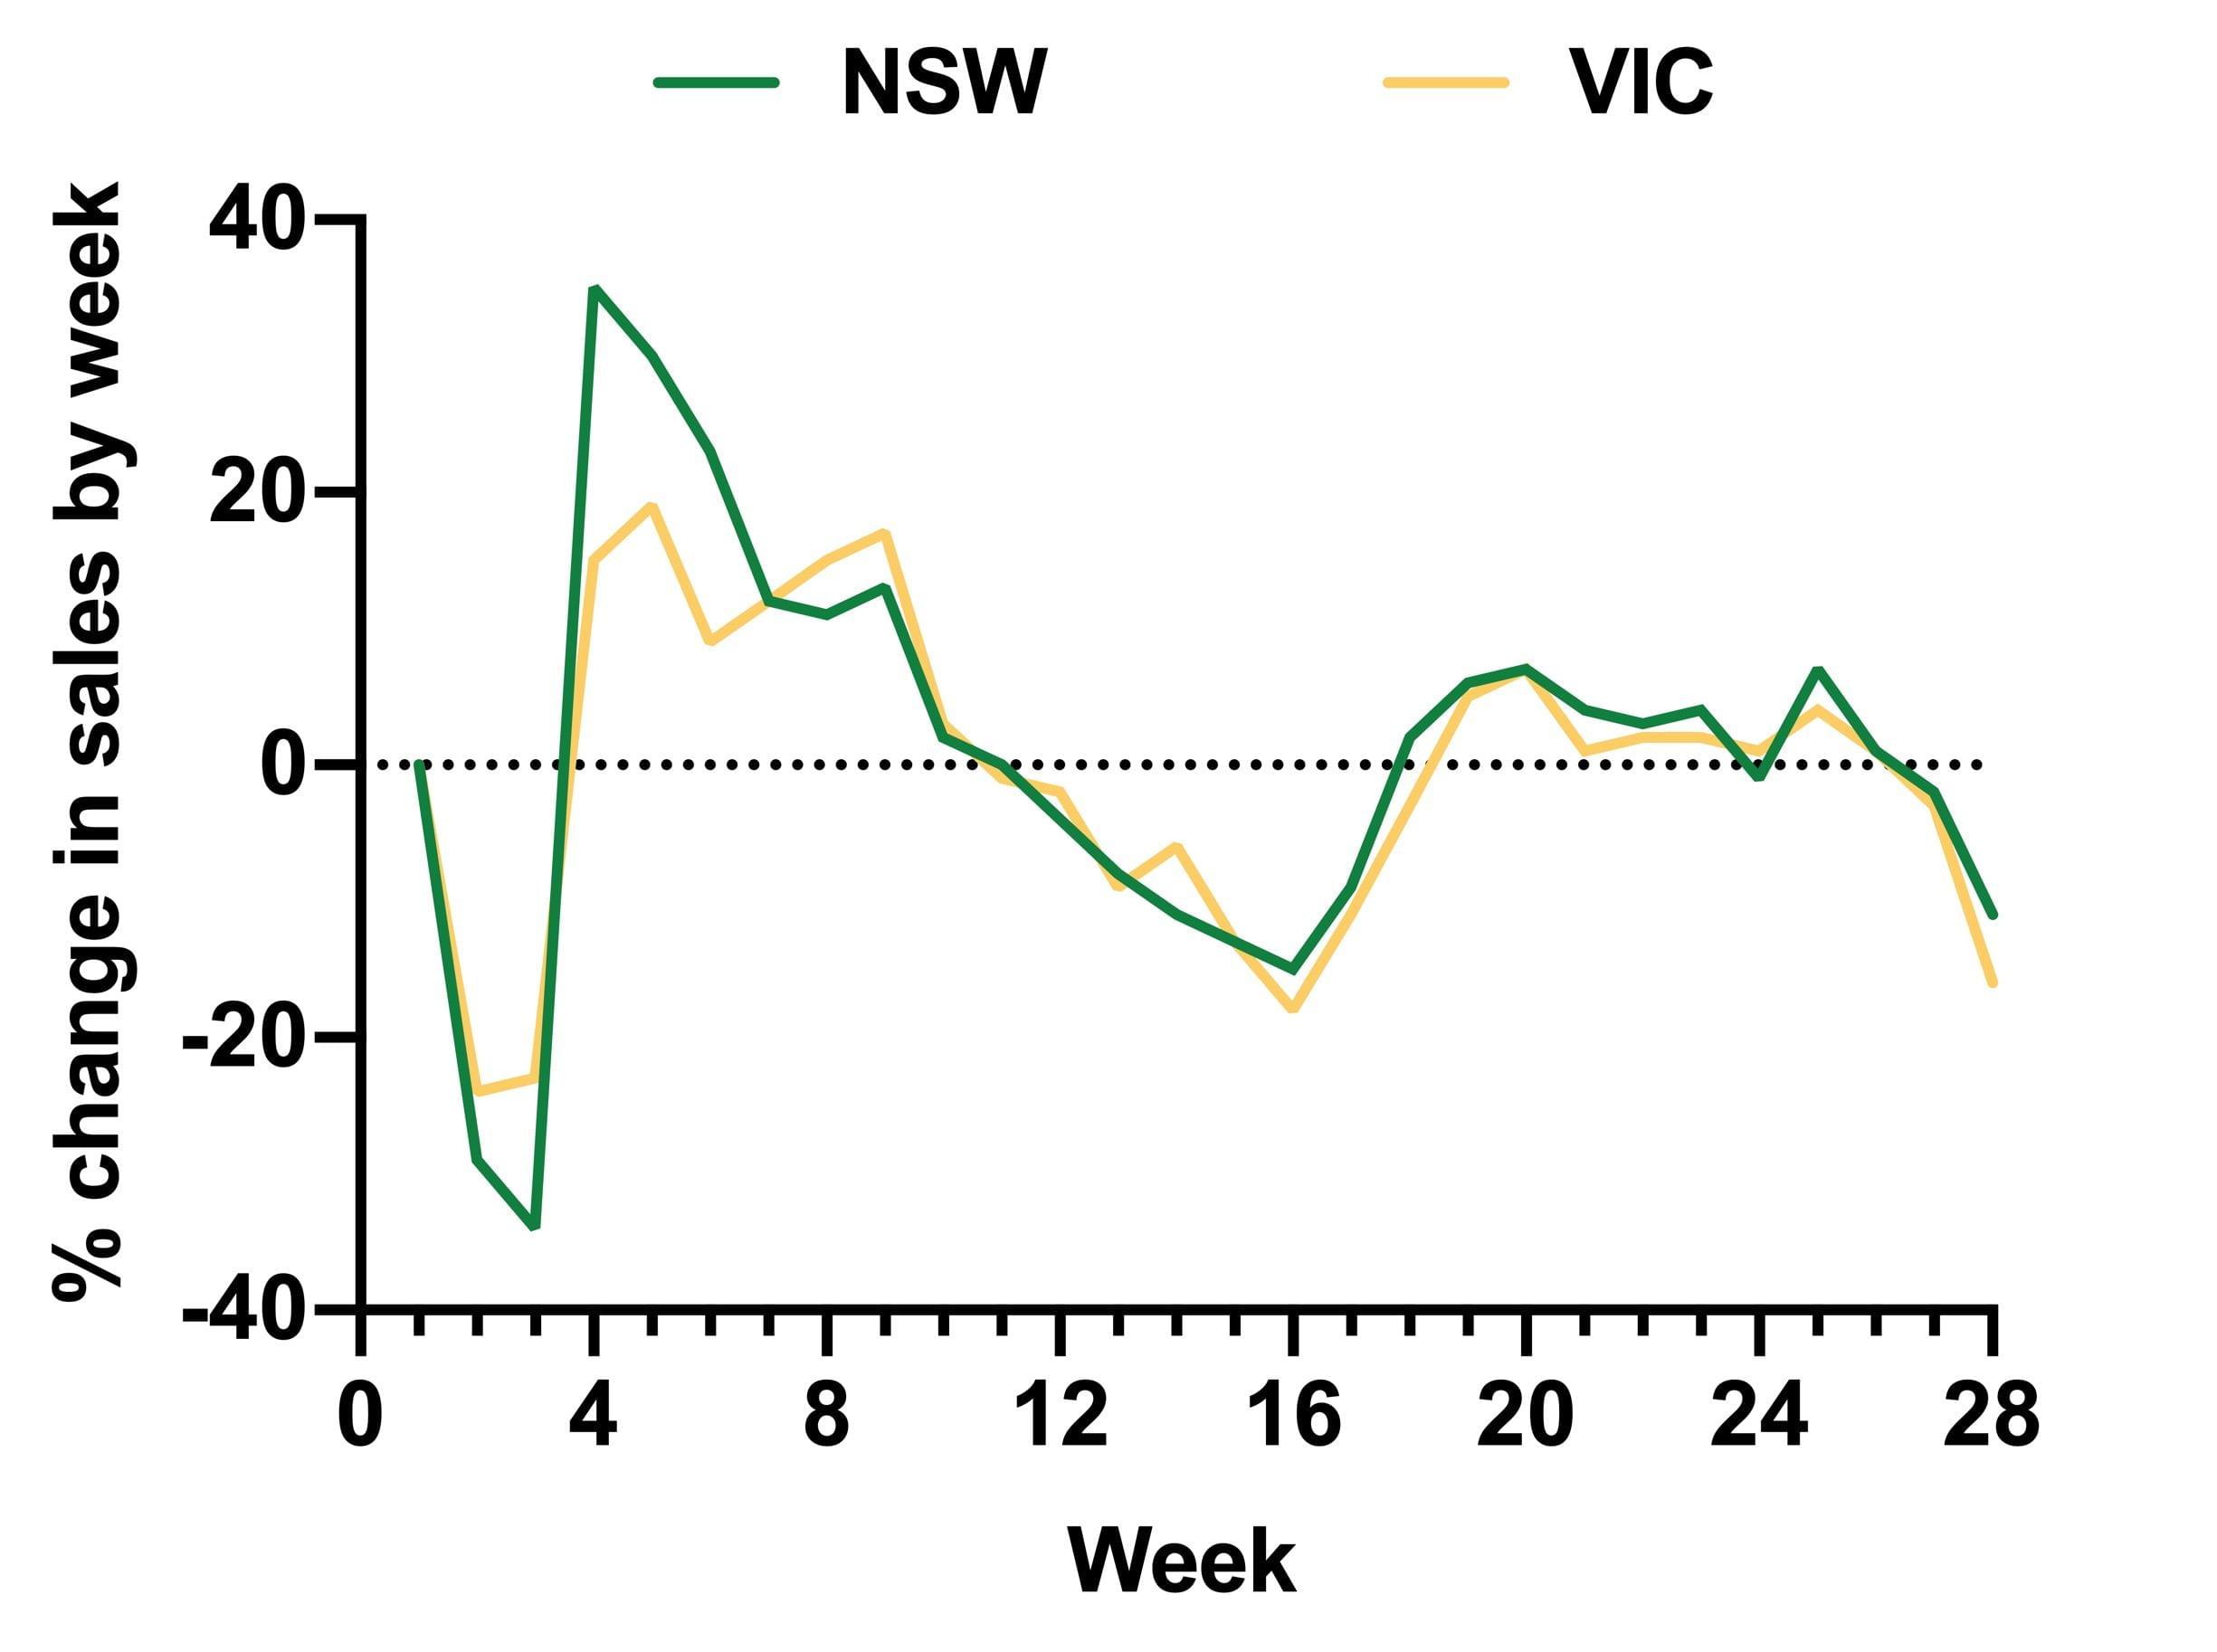
The deeper you go with data, the more interesting it gets. When we look at transactions on a state level, we can see that New South Wales is the state where sales volume has the smallest decrease in transactions compared to last year.
By the end of June, most states show a 35% decrease in sales volume year-on-year, while New South Wales is showing a 20% decrease.
Throughout 2020, however, sales looked to be improving in both New South Wales and Victoria, with both states showing between six to seven weeks of consecutive increases in sales. Again, with lockdowns in Victoria, we don’t expect this trend to continue for the state.
Queensland and South Australia have shown more disparity when looking at sales volumes year on year, and this gap has been increasing since the beginning of June. This is mostly because the number of sales in those states throughout June has been decreasing, while during the same time last year, sales were on an upward trend.
Western Australia, which has tended to lag behind some of our more bullish states, has finally shown an uptick in sales volume for 2020, with 4% growth at the end of June.
Metro areas versus regional - are they behaving differently?
At a national level, both metro and regional area sales volume look to be improving. From the 11th of May until the 21st of June, both sectors of the market have shown consecutive increases in sales, with metro areas increasing by 2% week-on-week, and regional areas by 3% week-on-week.
One week into July shows a slight decrease in sales across both metro and regional areas. This could be due to winter, which has historically been a quieter period in the real estate market.
Some of the areas around the country that have shown recent 5-6 weeks of consecutive sales volume increases include:
New South Wales
- Southern Highlands
- Central Coast region
- Mid North Coast
- Shoalhaven
- Sutherland
- Western Sydney
- Sydney Eastern Suburbs
Victoria
- Mornington Peninsula
- Geelong region
Queensland
- Mackay and Whitsundays
How long is it taking to sell a property?
We started off the year strong, with properties selling faster at the start of 2020 compared to the same time last year. From the middle of May to the middle of June, days on market begins to rise, and this is likely linked to more properties, and more sales transactions in the market. More listings leads to more competition for sellers, which could result in properties potentially taking longer to sell.
From the middle of June onwards, the time it takes to sell is around the same as this time last year, being between 65-70 days on average.
It goes without saying that homes that are presented well and priced competitively will achieve a quicker sale.
Is it faster to sell a property in metro or regional areas?
The last time we reported on days on market back in May, we noted that the time to sell in regional and metropolitan areas was converging. Since then, days on market in metro and regional areas are moving in opposite directions.
As it stands, on a national level, days on market for regional areas are trending up, taking around 90 days to sell a property.
Regional days on market at the end of June. Year-on-year comparison:
June 2019
83 days
to sell a property
June 2020
93 days
to sell a property
Metro days on market at the end of June. Year-on-year comparison:
June 2019
59 days
to sell a property
June 2020
54 days
to sell a property
In metropolitan areas days on market are trending down, where it’s taking roughly 55 days to sell.
Areas where properties are selling faster than the average regional days on market:
- Ballarat and Western District - Victoria
- Wollongong & Illawarra - New South Wales
- Newcastle Region - New South Wales
- Hobart and Southern Tasmania - Tasmania
- Central Coast Region - New South Wales
Areas where properties are selling faster than the average metro days on market:
- Sutherland - Sydney
- Eastern Suburbs - Sydney
- Northern Beaches - Sydney
- East - Melbourne
- North - Melbourne
So what does all this data mean for you as a seller?
Remember that while data can be insightful, you need to take any high level numbers with a grain of salt. While we can see that properties are still transacting, and that it’s not currently a case of doom and gloom, it’s still important to really research your local area.
Look at homes that are similar to yours that are currently on the market, are they listed for a substantially lower price than what they sold for a few years ago? Or have prices held? Are properties selling for what you would expect? What kinds of properties are selling relatively quickly?
We speak to agents and industry experts regularly, and what we’re hearing is that the properties that are presented well and priced competitively from the get go are the ones that gain momentum early on in a campaign and get good results.
In this article, we’ve called out a handful of regions where we can see positive activity, but these are just a sample of areas that are doing quite well, despite the overall disruption and sentiment in the market.
There are more out there, so take the time to discover your local market and speak to agents to find out what’s happening on the ground. If your property is in an area that’s doing quite well despite Covid-19, you could get a good result while there isn’t a glut of properties on the market.
No-one knows what spring will hold - there could be a barrage of sellers who are waiting for a time of year that has historically been known as a great time to sell. So if you’re holding off, seriously consider whether it’s a good idea to hold or bite the bullet now while there’s less competition.
Stick to the facts
Any forecasts predicting what will happen in the market should be taken with a degree of caution. It’s safe to say that no-one can really predict what’s going to happen in the market with complete certainty. Covid-19 is an unpredictable and disruptive virus that can pounce and force us to change course at any moment.
Secondly, if you’re watching the market as a potential seller or buyer, it’s important to dig deeper into the data.
It’s easy to feel like everything is going to mush when you see high level indices released by some of our biggest data providers stating that Sydney or Regional NSW have dropped in value, but the reality is that when it comes to data, you have to get granular and maintain perspective. While there may have been mild drops in value over the past month or two, you may find that home value growth over an entire year is still very impressive.
Try not to be swayed into a negative spiral when it comes to high level indices; while it’s an interesting overall snapshot of a city or region, you need to understand that movements down to an individual postcode level are very different. The price you might achieve for your home is influenced by so many factors, not just how your entire city is performing. You need to get in and really look at the details.
That means, looking at local suburb trends, seeing what’s selling in your area and for how much and how quickly. Because we need to remember that a city like Sydney is a very big place, filled with a huge cross-section of different markets, as well as markets within markets, so a high level data point about sliding property values isn’t a catch-all approach.
What if you need to sell?
If you need to sell your property for whatever reason, it’s still entirely possible and sellers are still reporting fantastic results.
While transaction volumes are lower, there are still buyers out there, and lending rates are the lowest they’ve ever been. Our daily conversations with agents tell us (anecdotally) that well-presented properties that are priced reasonably are still selling.
While one suburb might be really feeling the brunt of Covid-19, the area you live in might be doing quite well, so watch the market closely, and do your research.


